
MODULE IA
Inventory Analysis
Inventory Analyzer (IA)
Reveals inventory dwell time, turnover, and placement efficiency.
Tap the image to open its description
01About
Overview

IA analyzes the state of in-warehouse inventory from multiple angles (inventory volume, outbound ABC, dwell, and turnover analysis) to support decisions on optimizing inventory placement. Its goal is to make inventory analysis, once tallied by hand in Excel, real-time and visual.
Challenges IA Solves
Inefficient inventory placement
Frequently shipped items sit in distant locations, making picking paths long. With no basis for revising placement, the inefficiency is left as is.
Neglected slow-moving stock
Items that have not shipped for a long time occupy the golden zone (the easiest shelf positions to pick from). High-turnover items that belong there are pushed to distant locations.
Poor visibility of inventory turnover
Turnover by item is unknown, so decisions on replenishment timing and placement changes come late. The risk of excess stock and stockouts rises.
Manual ABC analysis
Tallying in Excel takes hours to days, so nothing is real-time. Analysis happens only about once a month, and responses to change are slow.
02Workflow
Operational Flow
- 1
Data comes in
Stock quantities and in/out, ship frequencyStock, in/out, and shipping frequency
- 2
Seen on screen
Daily stock and inbound / outbound movementDaily stock and in/out movement
- 3
Spot issues
Distant A items and slow-moving stockDistant A items and slow-moving stock
- 4
Take action
Revise placement together with SORevise placement together with SO
- 5
Results change
Shorter travel paths, better use of storageShorter travel paths, better use of storage
Inspect the original interface
Inventory analysis with IA consists of four steps.
Step 1
Inventory Overview
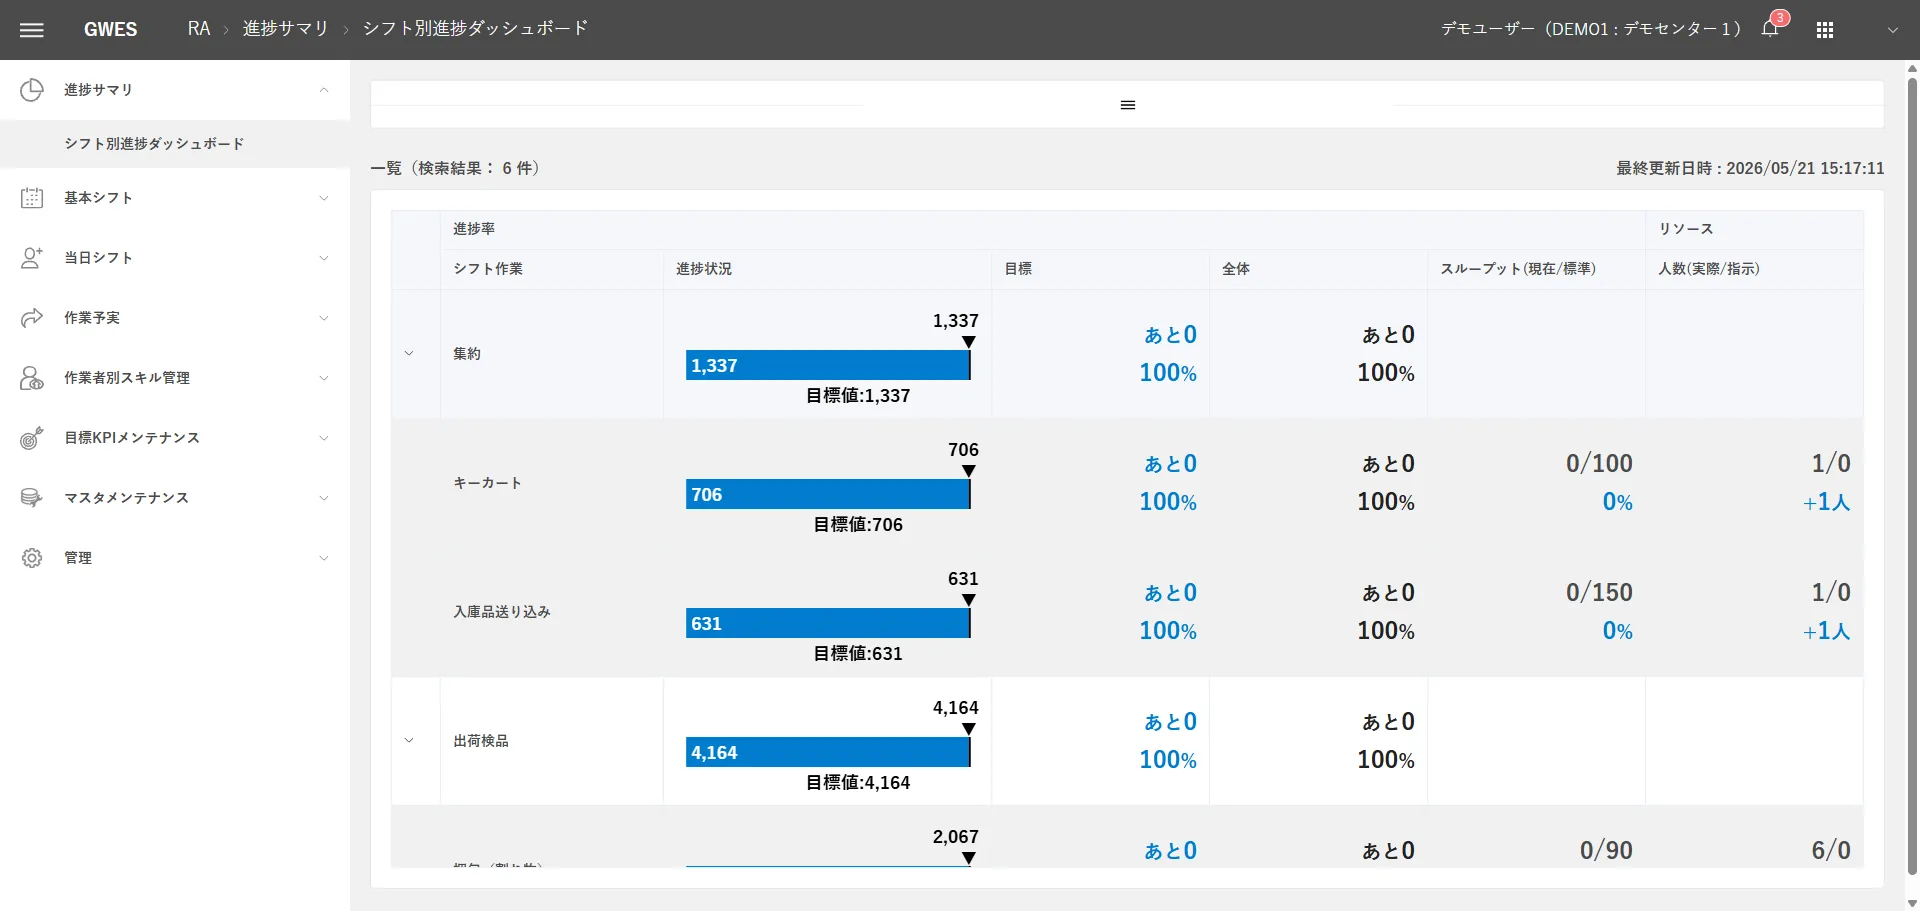
- See the big picture in the inventory treemap
Step 2
Outbound ABC Analysis
- ABC classification by shipping frequency
Step 3
Dwell Analysis
- Check dwell days by item
Step 4
Placement Optimization
- Propose location reassignments
First grasp the overall picture of inventory, then classify items by shipping frequency with ABC analysis, identify improvement targets with dwell analysis, and finally optimize placement together with SO.
IA analysis is not a one-off; repeating it regularly maximizes its effect. Because ABC ranks change with seasons and product changeovers, we recommend updating the analysis monthly to quarterly and revising placement with SO.
03Features
Key Features
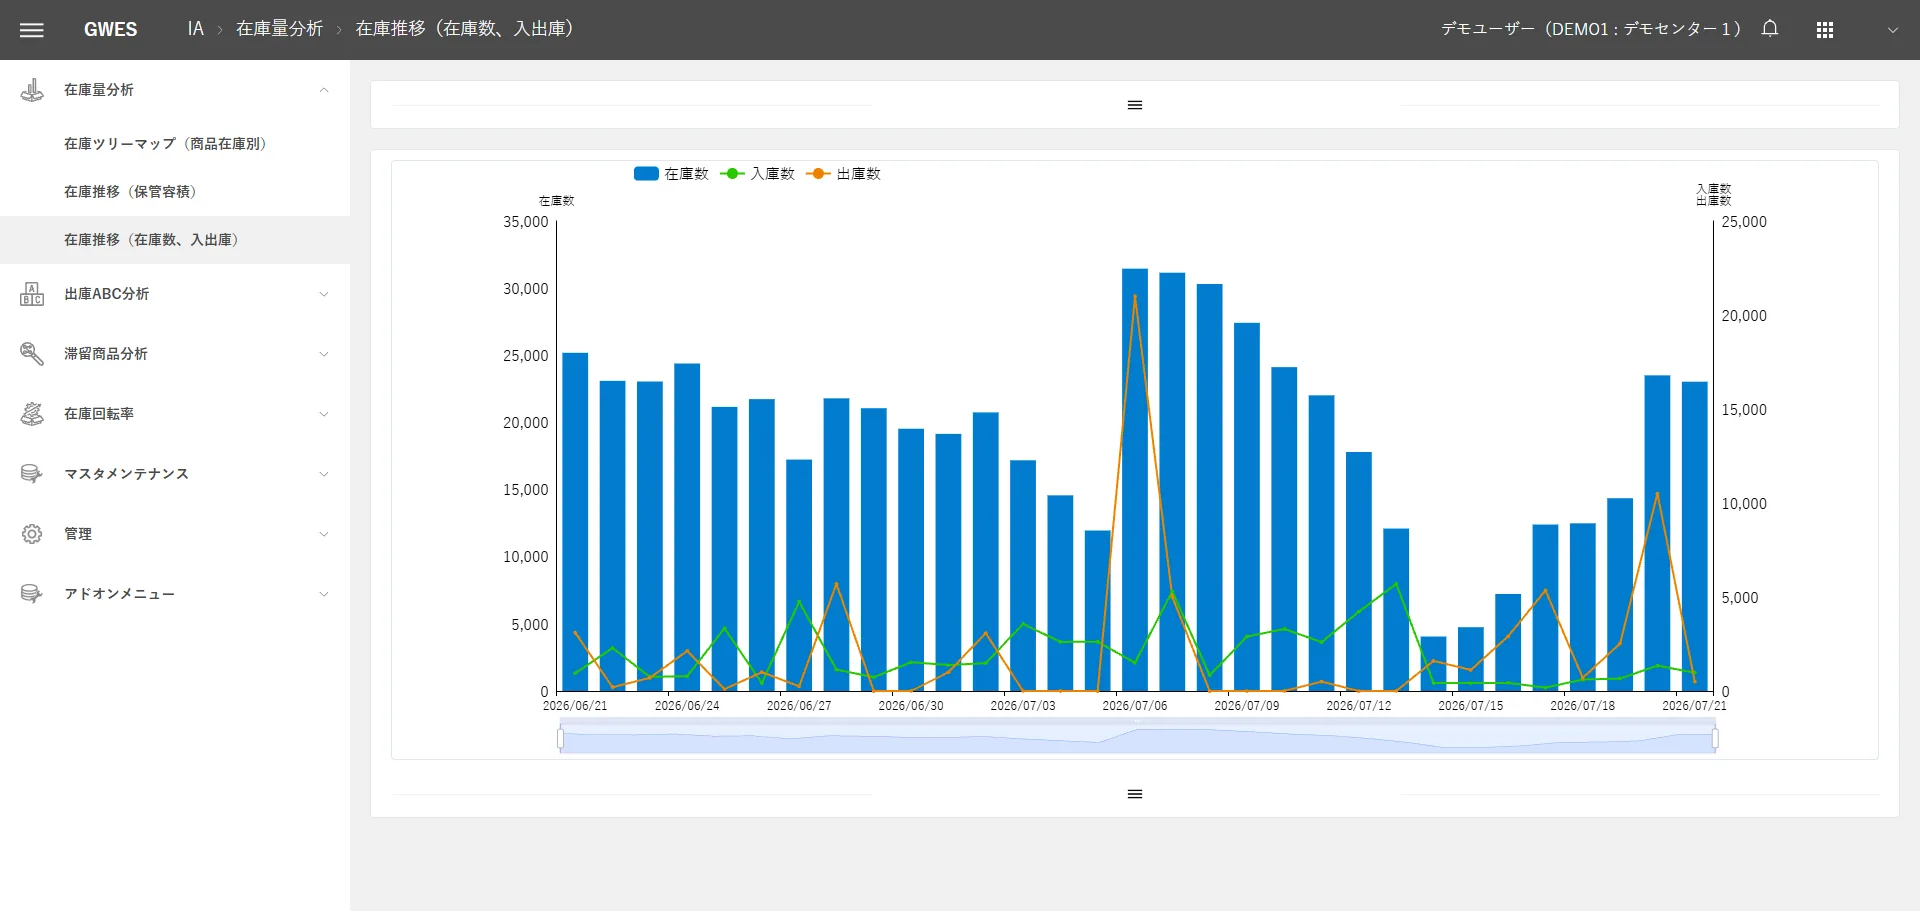
Inventory Trend (Qty, In/Out) Inventory Volume Analysis
Inventory volume analysis is the first step of inventory analysis with IA. It shows visually how much stock sits in each category in the warehouse, and checks inventory imbalances and trends.
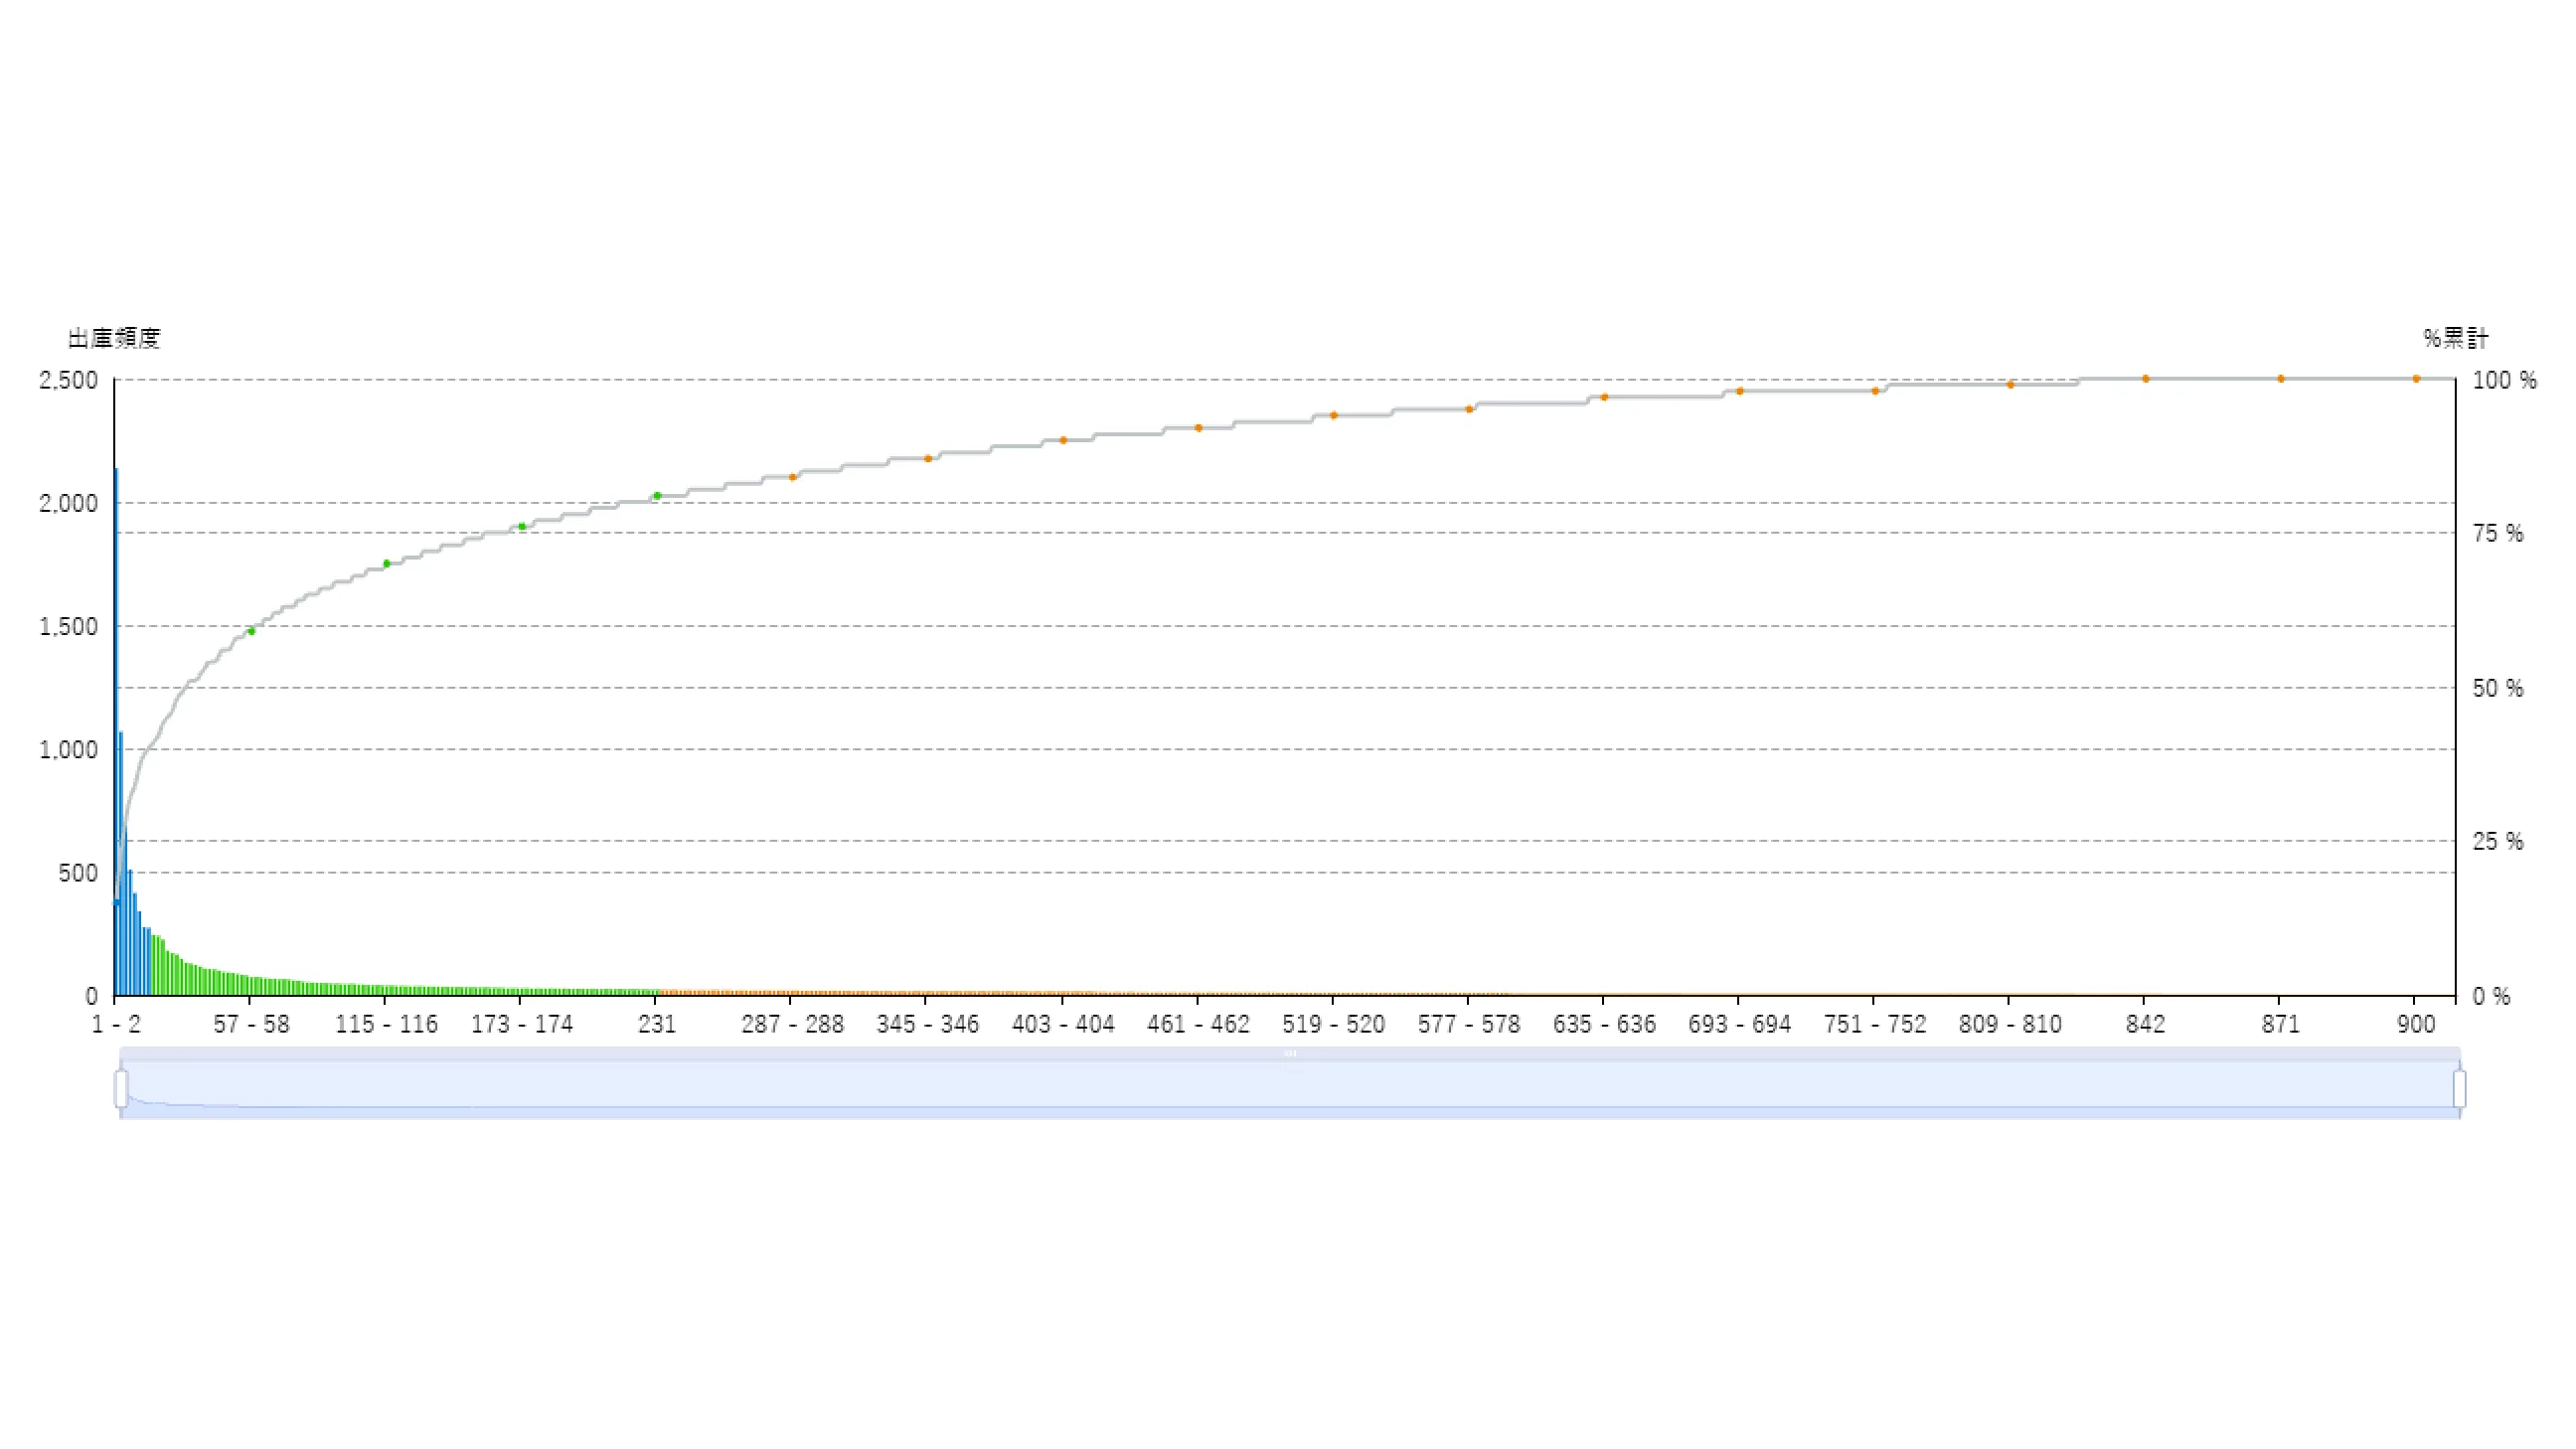
Outbound ABC Pareto Outbound ABC Analysis
Outbound ABC analysis is IA's core feature. It ranks items as A (high frequency), B (medium frequency), or C (low frequency) by shipping frequency, and evaluates from multiple angles whether the current location assignments suit shipping efficiency.
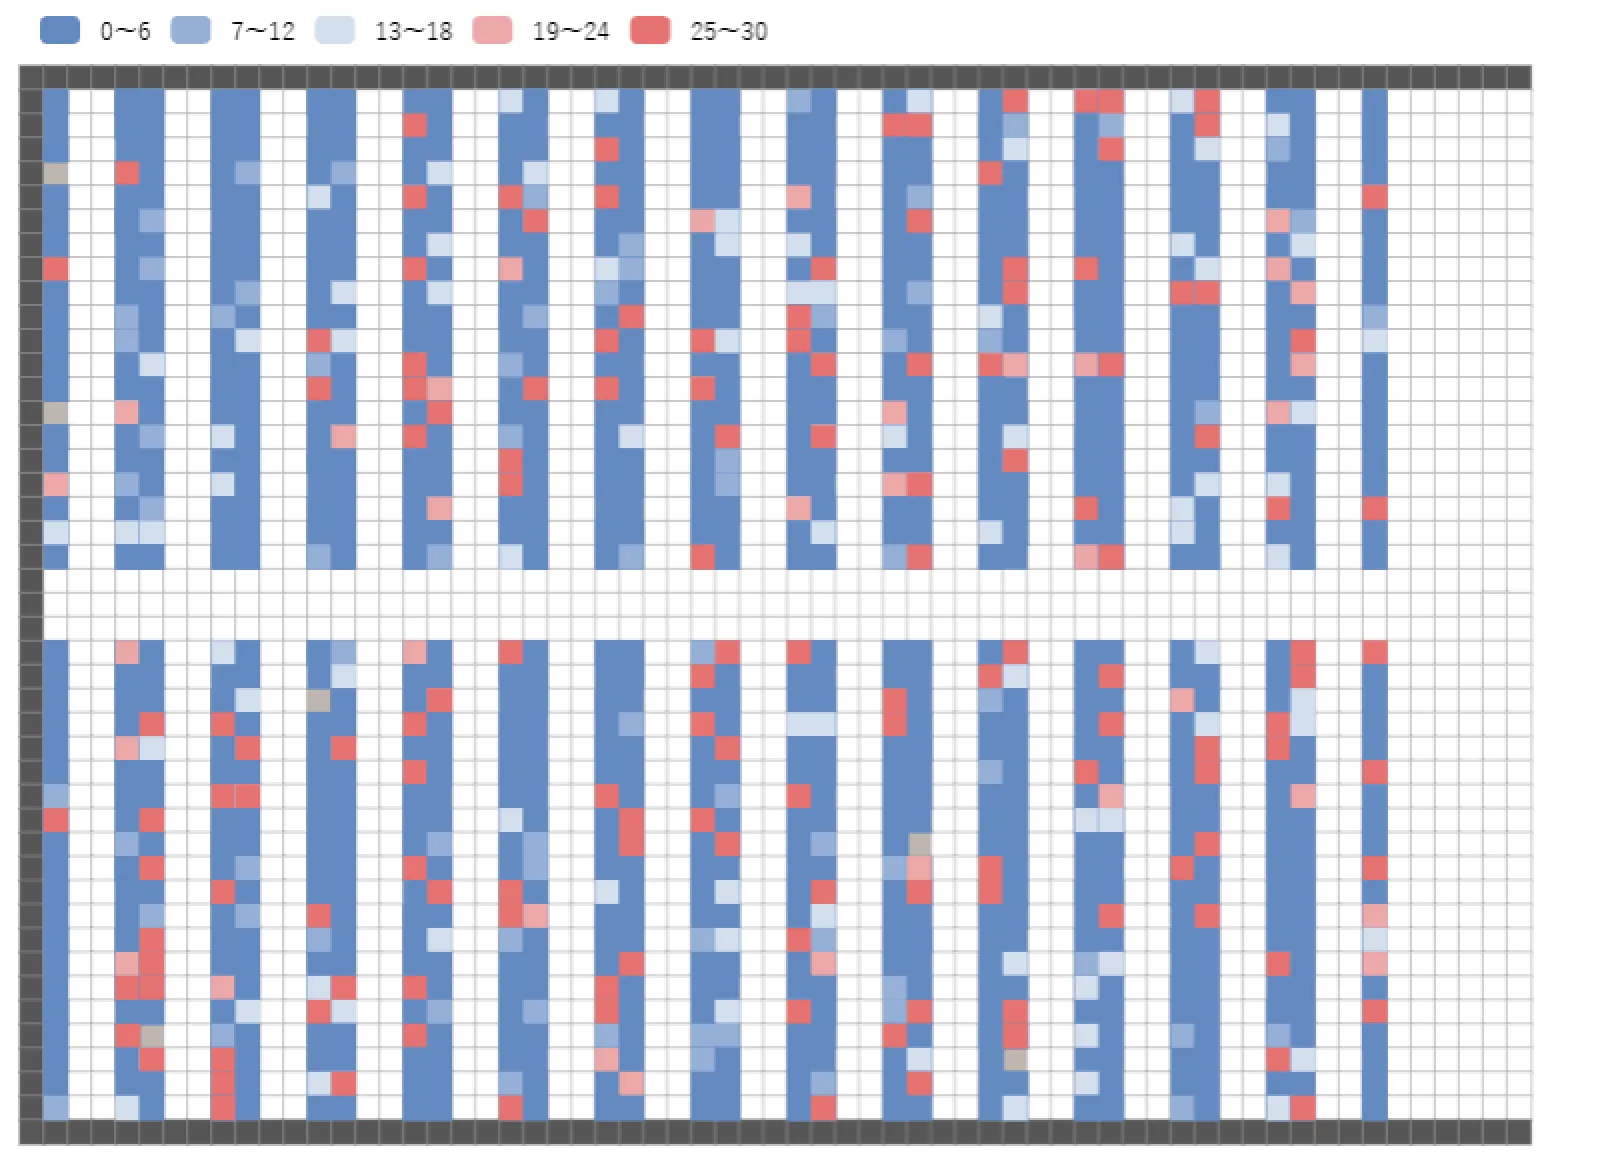
Slow-Moving Stock Heat Map Slow-Moving Item Analysis
Slow-moving item analysis identifies “dormant stock” that has not shipped for a long time, and promotes better use of storage space.
Inventory Turnover
Inventory turnover is a metric showing how many times inventory is replaced within a given period. Higher turnover means more efficient inventory; lower turnover means stock is sitting idle.
Tap the image to open its description
ABC Analysis Basics
Typically, A items (the top 20% of items) account for about 80% of total shipping volume (the Pareto principle). Placing A items in the “golden zone” near the shipping dock greatly shortens picking paths. IA automates this analysis in real time.
04Modules
Other GWES Modules
Visualization & Analysis



Optimization




Infrastructure



FIRST STEP
See where you stand with a free GPIM assessment
We clarify which level your logistics facility is at now and what to do next.