
MODULE WA
Work Results Analysis
Workload Analyzer (WA)
Reveals productivity and cost trends from results by process and site.
Tap the image to open its description
01About
Overview

WA analyzes past work results, including the current day, from multiple angles such as by time slot, by worker, by process, and by day, supporting productivity improvement and decision-making in warehouse operations. While PA (Progress Analyzer) specializes in “real-time progress monitoring,” WA specializes in “accumulating and analyzing results data.”
Challenges WA Solves
Too little analysis of work results
Only rough daily-report totals exist, so results cannot be analyzed by time slot, worker, or process. Clues for improvement stay buried.
Uneven productivity
Productivity gaps between workers and between time slots are not visible, so improvement points cannot be identified. The gap between veterans and newcomers is not quantified either.
Opaque cost structure
The link between labor hours and shipping volume is not visible, so there is no basis for cutting costs. There is no basis for judging whether labor costs are appropriate.
No trend analysis
Daily, weekly, and monthly trends are unknown, so seasonal changes and improvement effects cannot be measured. The data cannot inform medium- to long-term plans.
02Workflow
Operational Flow
- 1
Data comes in
WMS work results and cost dataWMS work results and cost data
- 2
Seen on screen
Results by process/worker and multi-center comparisonProcess/worker results, center comparison
- 3
Spot issues
Bottlenecks and uneven productivityBottleneck processes, uneven productivity
- 4
Take action
Revise staffing, plan skill developmentRevise staffing, plan skill development
- 5
Results change
Higher productivity, optimized labor costsHigher productivity, optimized labor costs
WA operations consist of four main phases.
Phase 1
Initial Setup
- Register worker master data
Phase 2
Results Collection
- Import work results from the WMS
Phase 3
Analysis
- Analyze throughput by process
Phase 4
Improvement
- Identify bottleneck processes
Set master data and KPIs in advance, collect daily work results automatically, analyze the accumulated data from multiple angles, and turn the findings into improvement actions.
03Features
Key Features
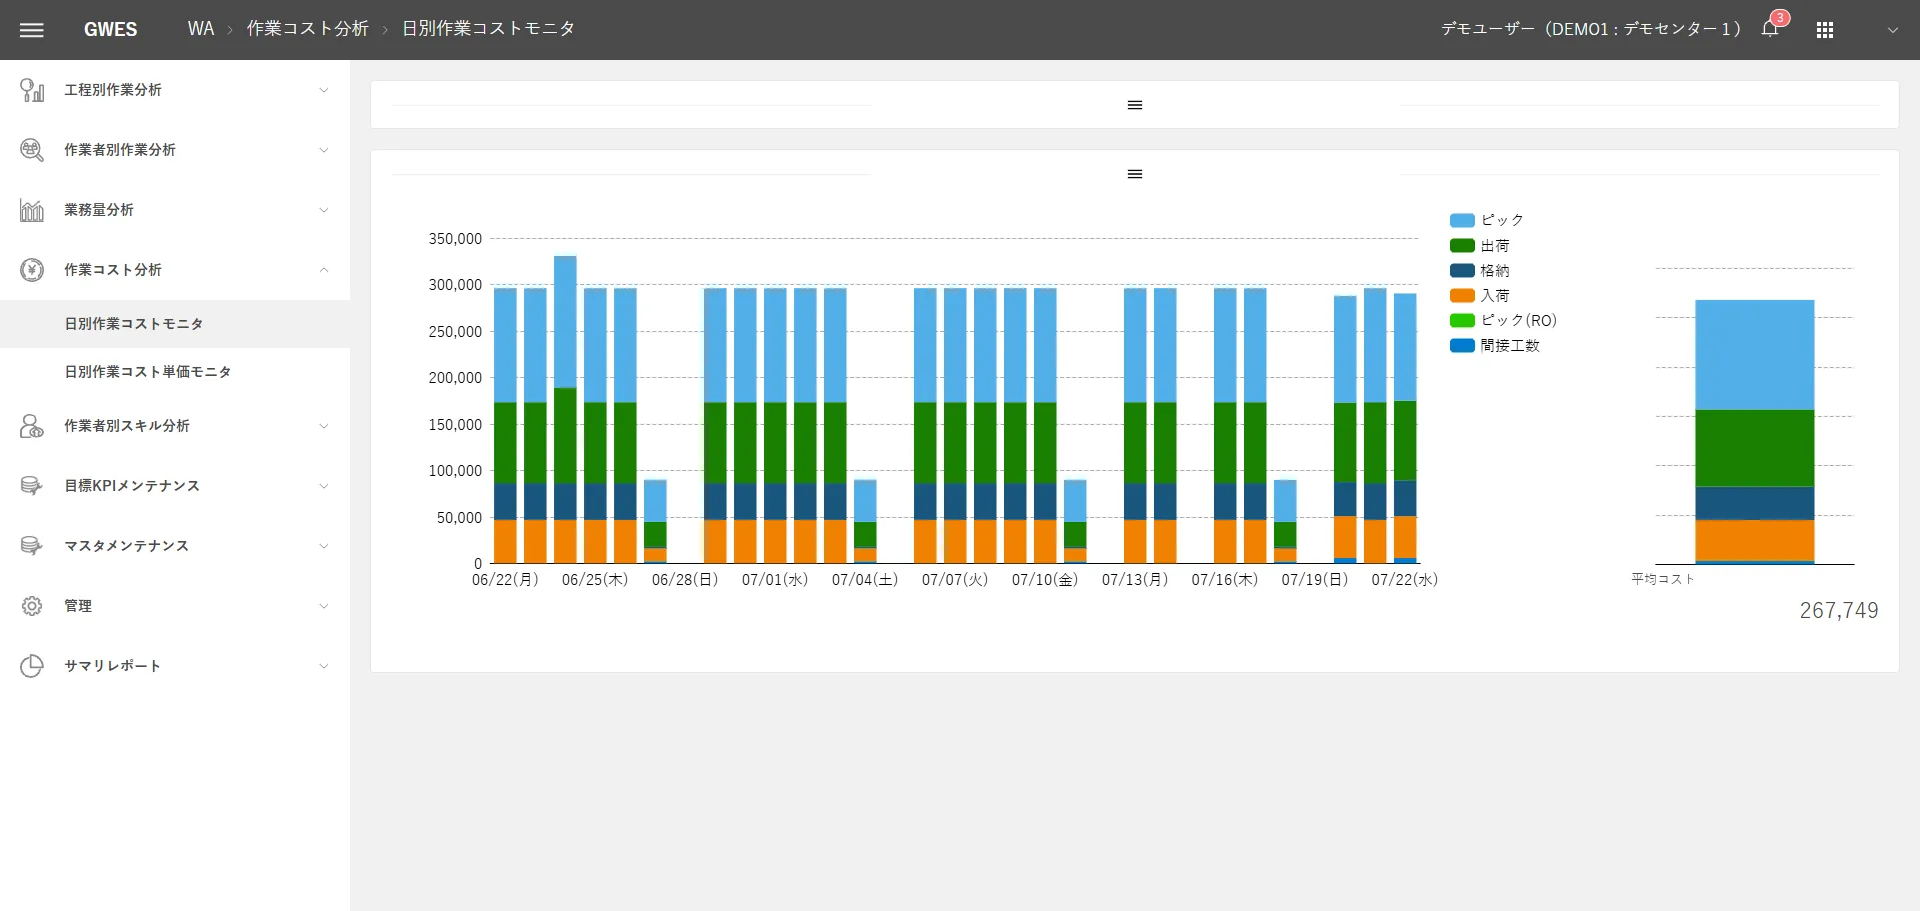
Daily Work Cost Monitor Work Cost Analysis
WA's cost analysis category is a set of screens that multiplies work results by unit costs to visualize the cost structure. It shows in numbers “how much each item costs” and “which processes are cost-inefficient,” helping optimize labor costs.
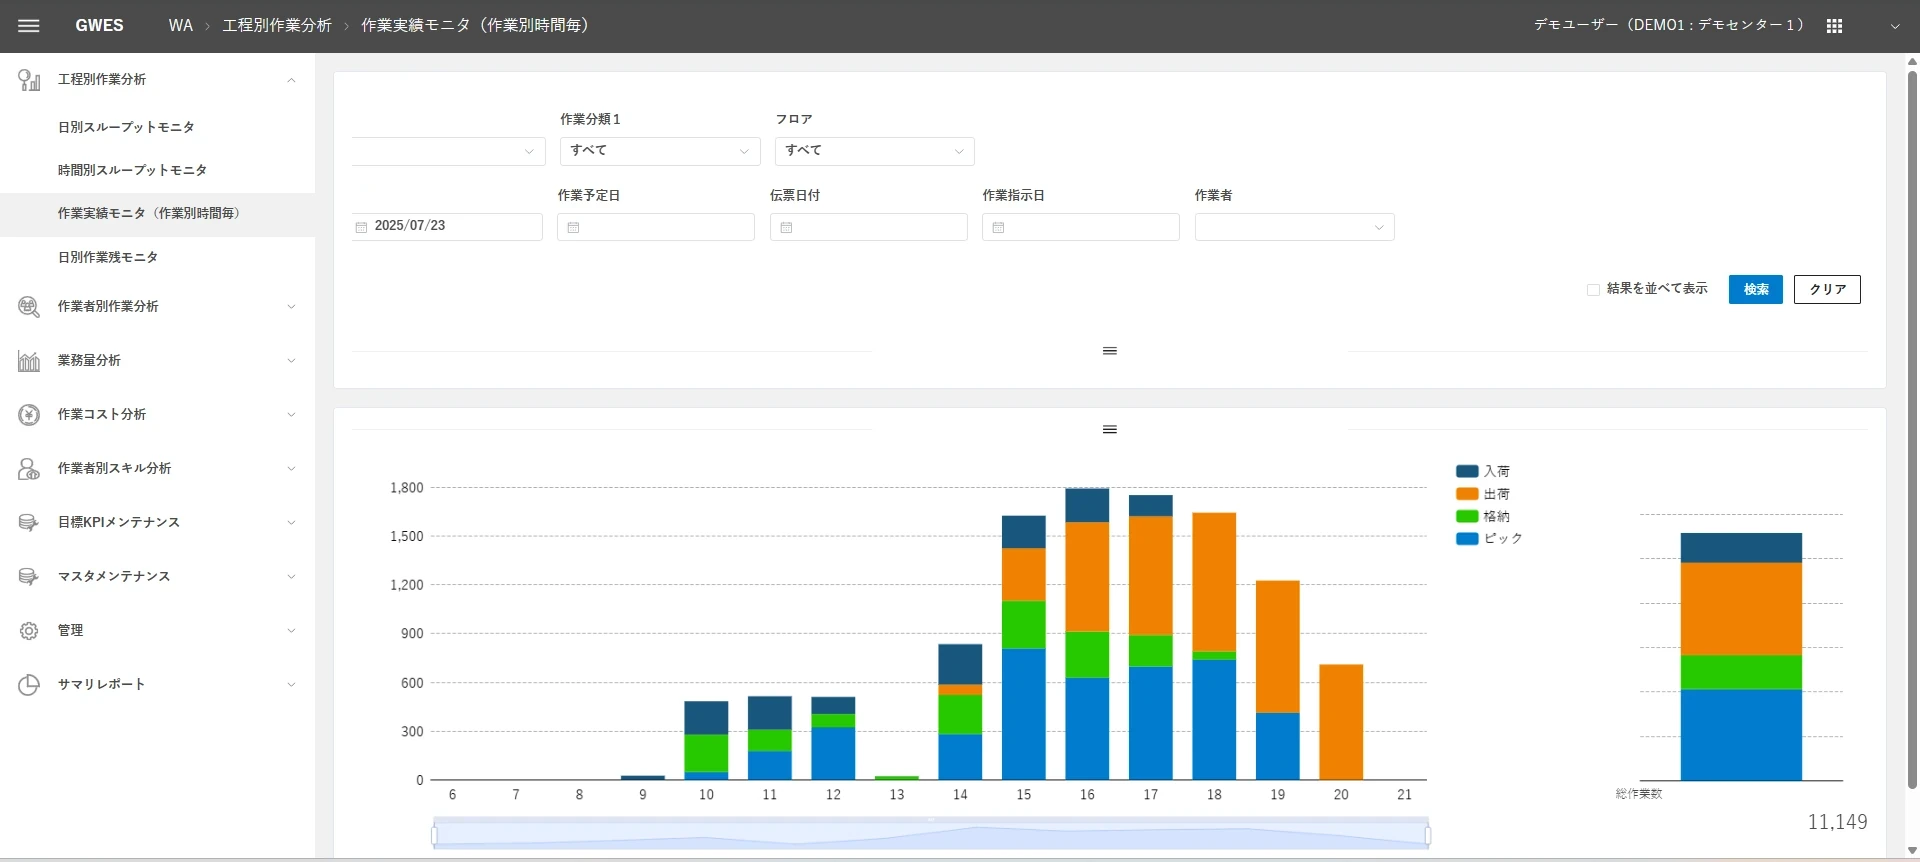
Work Results Monitor (Hourly by Task) Work Analysis by Process
Quantifies “which process handled how much work, and when,” and uses it to identify bottleneck processes and revise staffing.
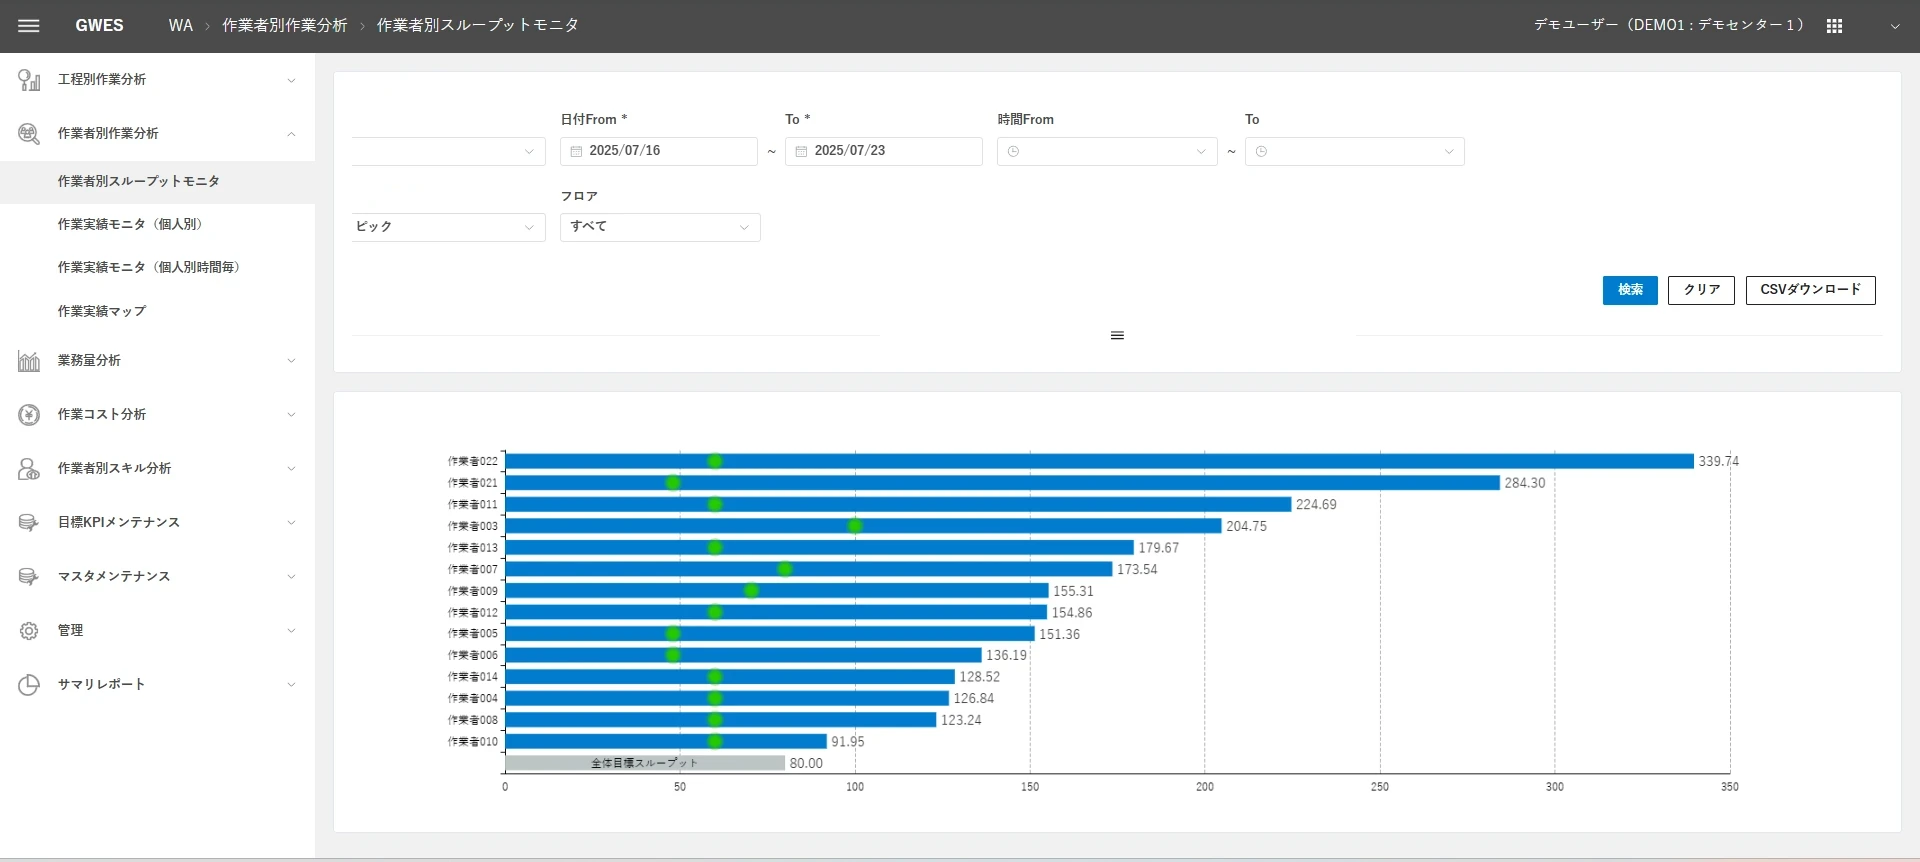
Throughput by Worker Monitor Work Analysis by Worker
Provides throughput comparison by worker, detailed work results for each person, performance changes by time slot, and quantitative management of worker skills.
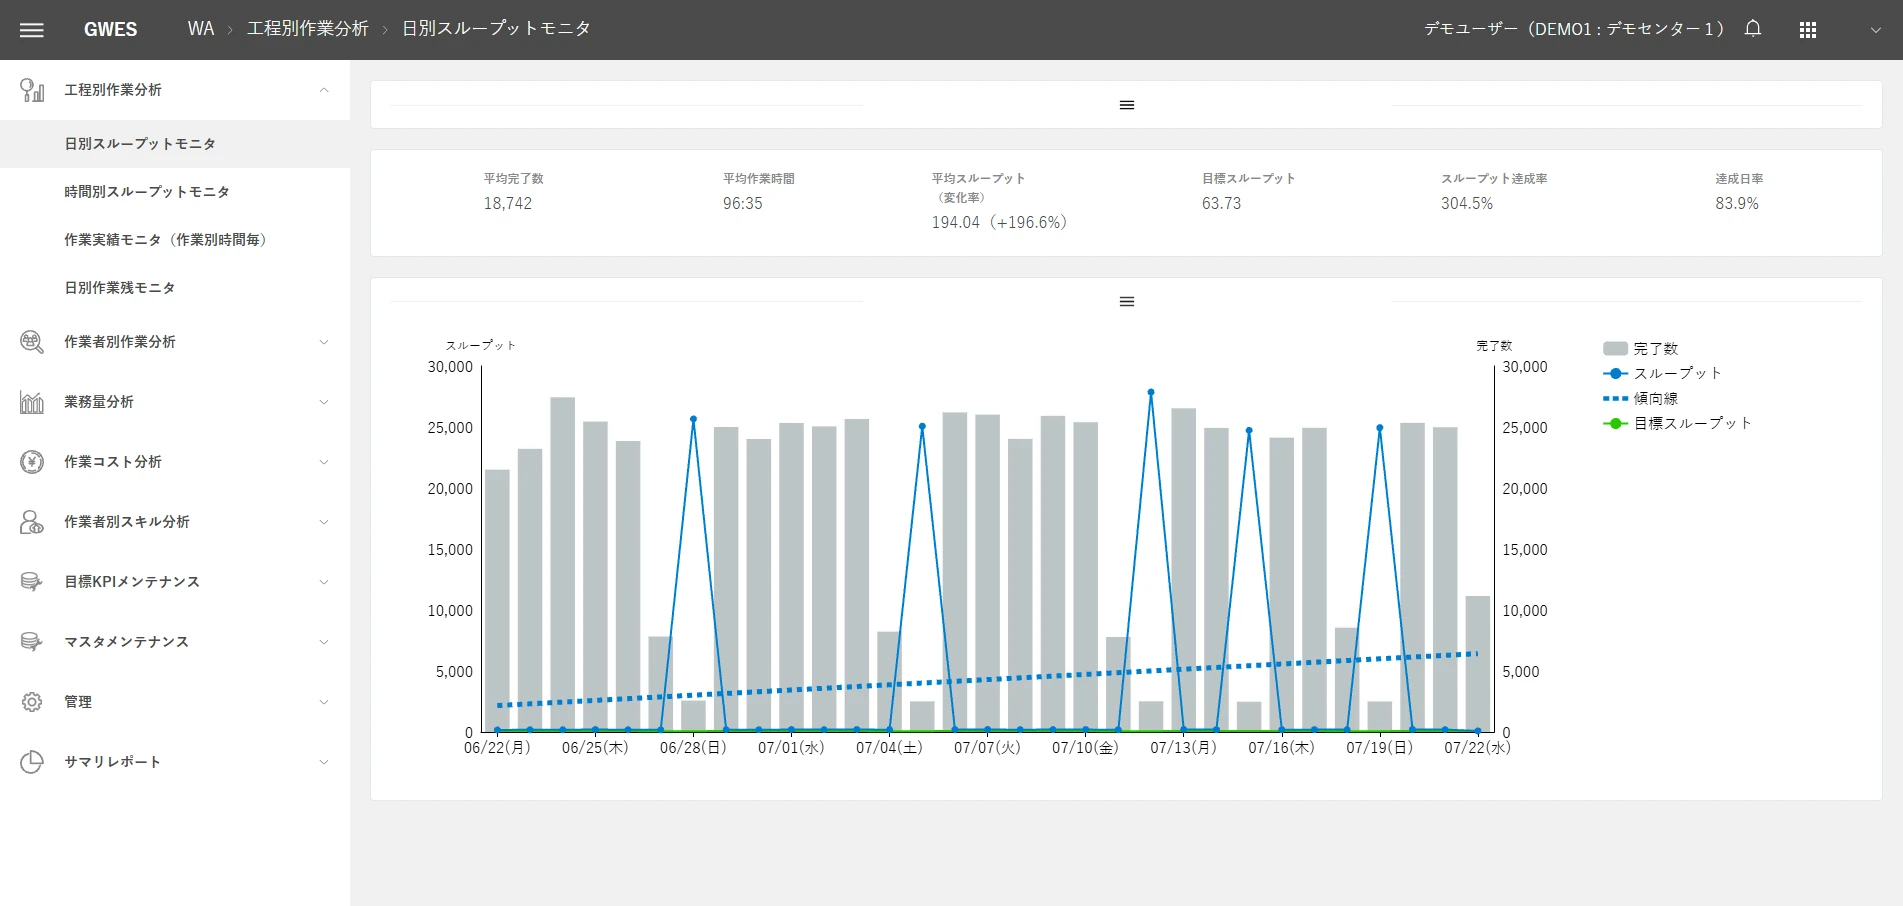
Daily Throughput Monitor Workload Analysis
The workload analysis category provides a macro view of overall warehouse operations, including matching workload forecasts against actual results, analyzing actual staffing, and summarizing work results by hour and by day.
Skill Analysis by Worker
WA's skill analysis feature manages the skills each worker holds in numbers and supports planned staff development. It lists “who can do what” and tracks progress in multi-skilling.
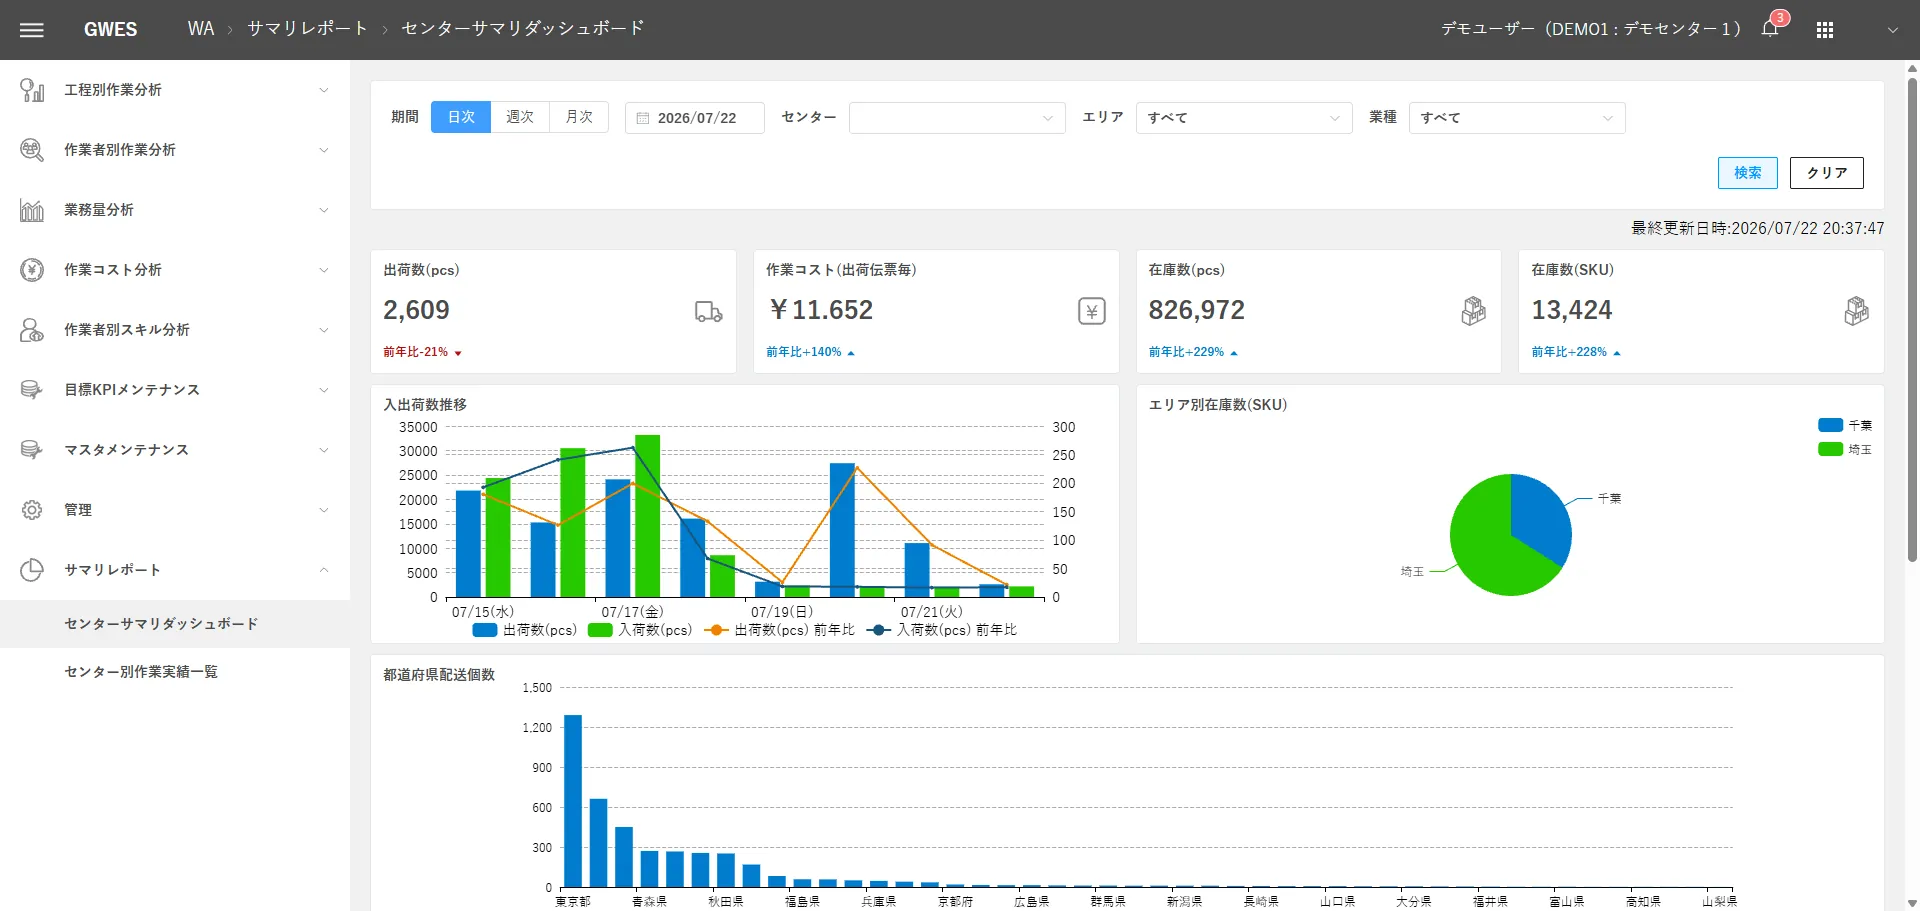
Summary Reports
A set of screens for companies running multiple warehouse sites (centers), comparing results across sites.
Tap the image to open its description
04Modules
Other GWES Modules
Visualization & Analysis
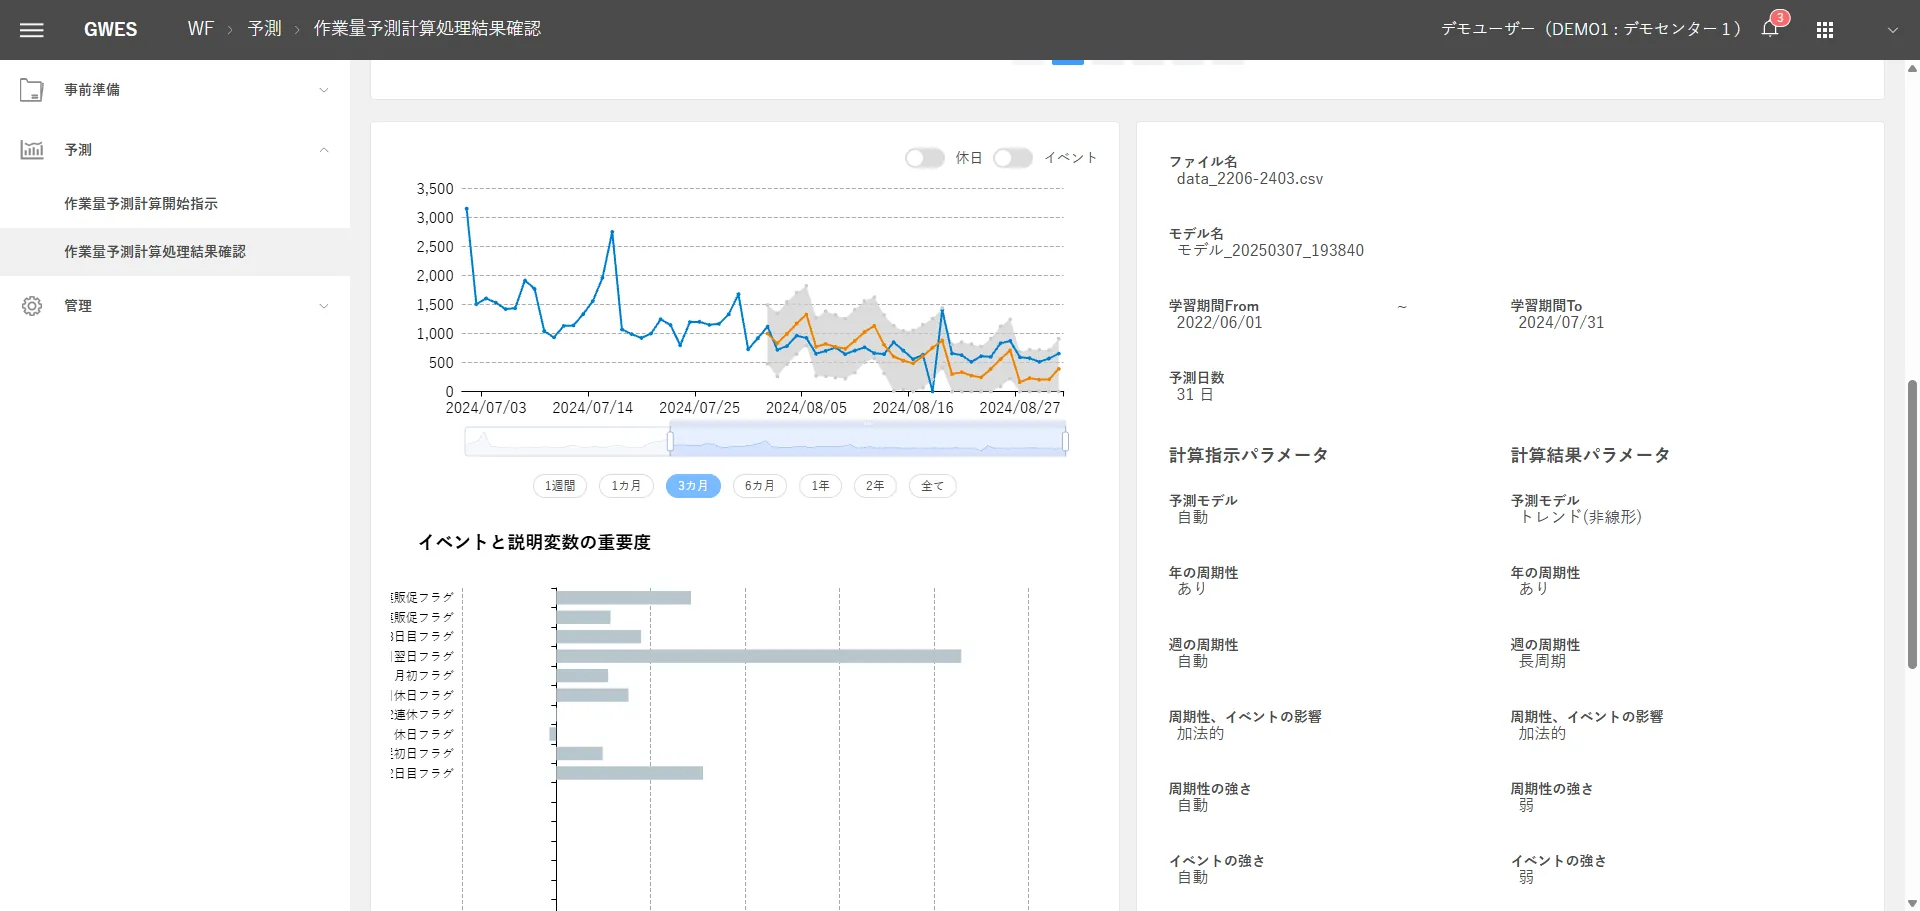

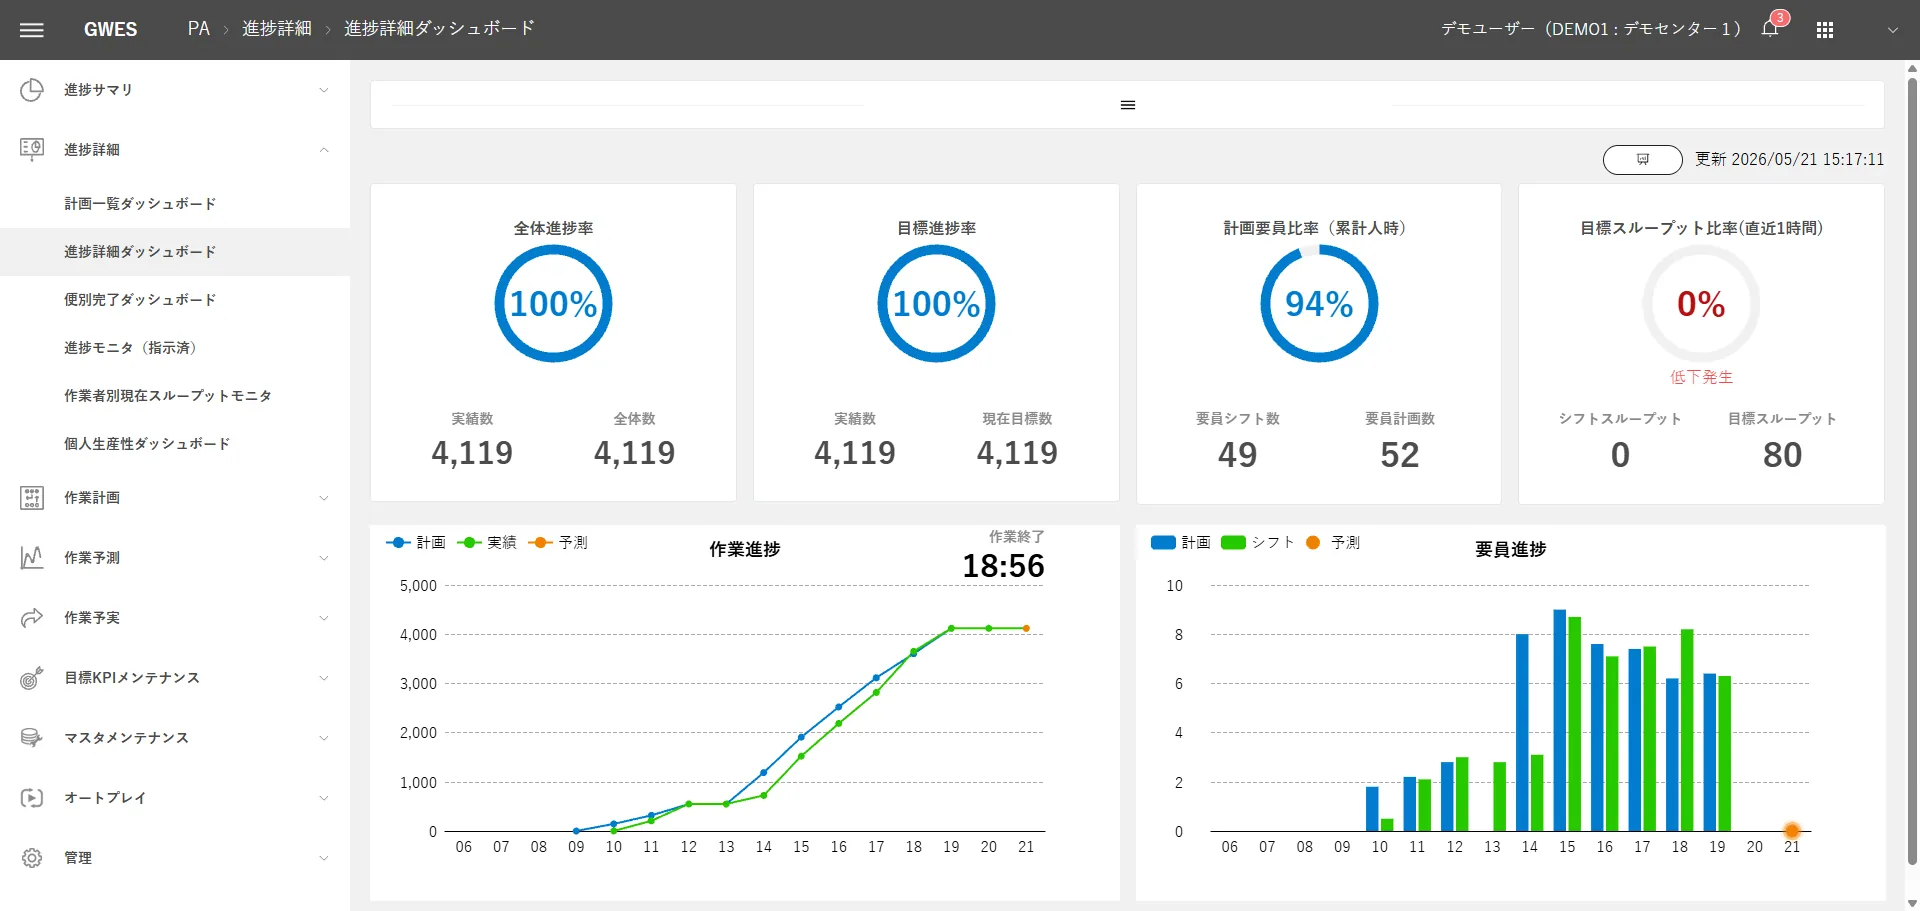

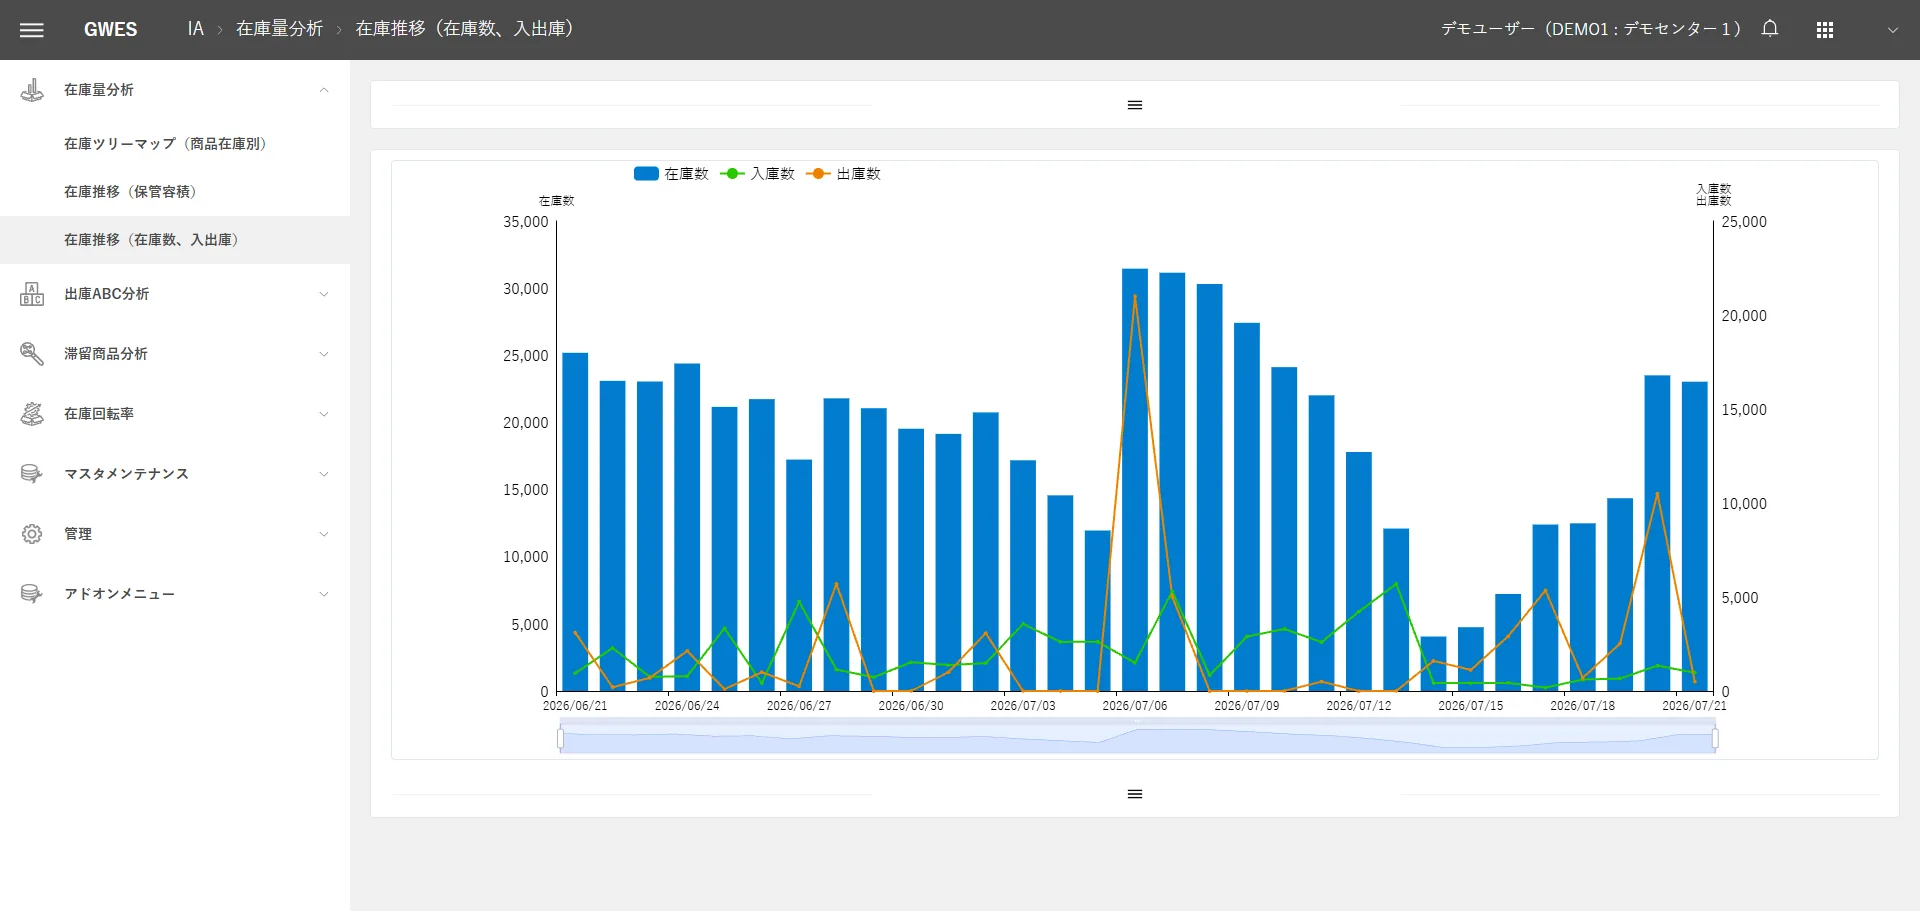

Optimization




Infrastructure



FIRST STEP
See where you stand with a free GPIM assessment
We clarify which level your logistics facility is at now and what to do next.