
MODULE SO
Inventory Placement Optimization
Slotting Optimizer (SO)
Finds the best storage locations and zones from shipping frequency and travel paths.
Tap the image to open its description
01About
Overview

Using mathematical optimization (combinatorial optimization + graph theory), SO optimizes putaway location instructions, location moves, and replenishment instructions to shorten picking paths and raise work efficiency.
In distribution centers, problems arise every day: frequently shipped items sit in distant locations, and poorly timed replenishment causes stockouts. SO solves these problems with data, giving optimal instructions on “which item” to move, “to which location,” and “when.”
Challenges SO Solves
Mismatch between shipping frequency and placement
Best-selling items sit at the back of the warehouse, so picking paths grow long. Workers walk farther, and productivity falls.
Stockout risk from late replenishment
Empty pick locations are noticed late, and picking stops. Waiting for out-of-stock items causes shipping delays.
Person-dependent location changes
Inventory relocation depends on veterans' experience and intuition. Responses to seasonal and trend changes lag, and chances to optimize are missed.
02Workflow
Operational Flow
- 1
Data
Stock and outbound trends, locationsStock/outbound trends and locations
- 2
Calculate
SO optimizes moves, refills, and putawaySO optimizes moves, refills, putaway
- 3
Instructions on screen
Location instructions for moves, refills, putawayLocations for moves, refills, putaway
- 4
Work as instructed
Instructions to the WMS for moves, refills, putawayMoves, refills, putaway via the WMS
- 5
Impact
Shorter paths, better efficiencyShorter picking paths, higher efficiency
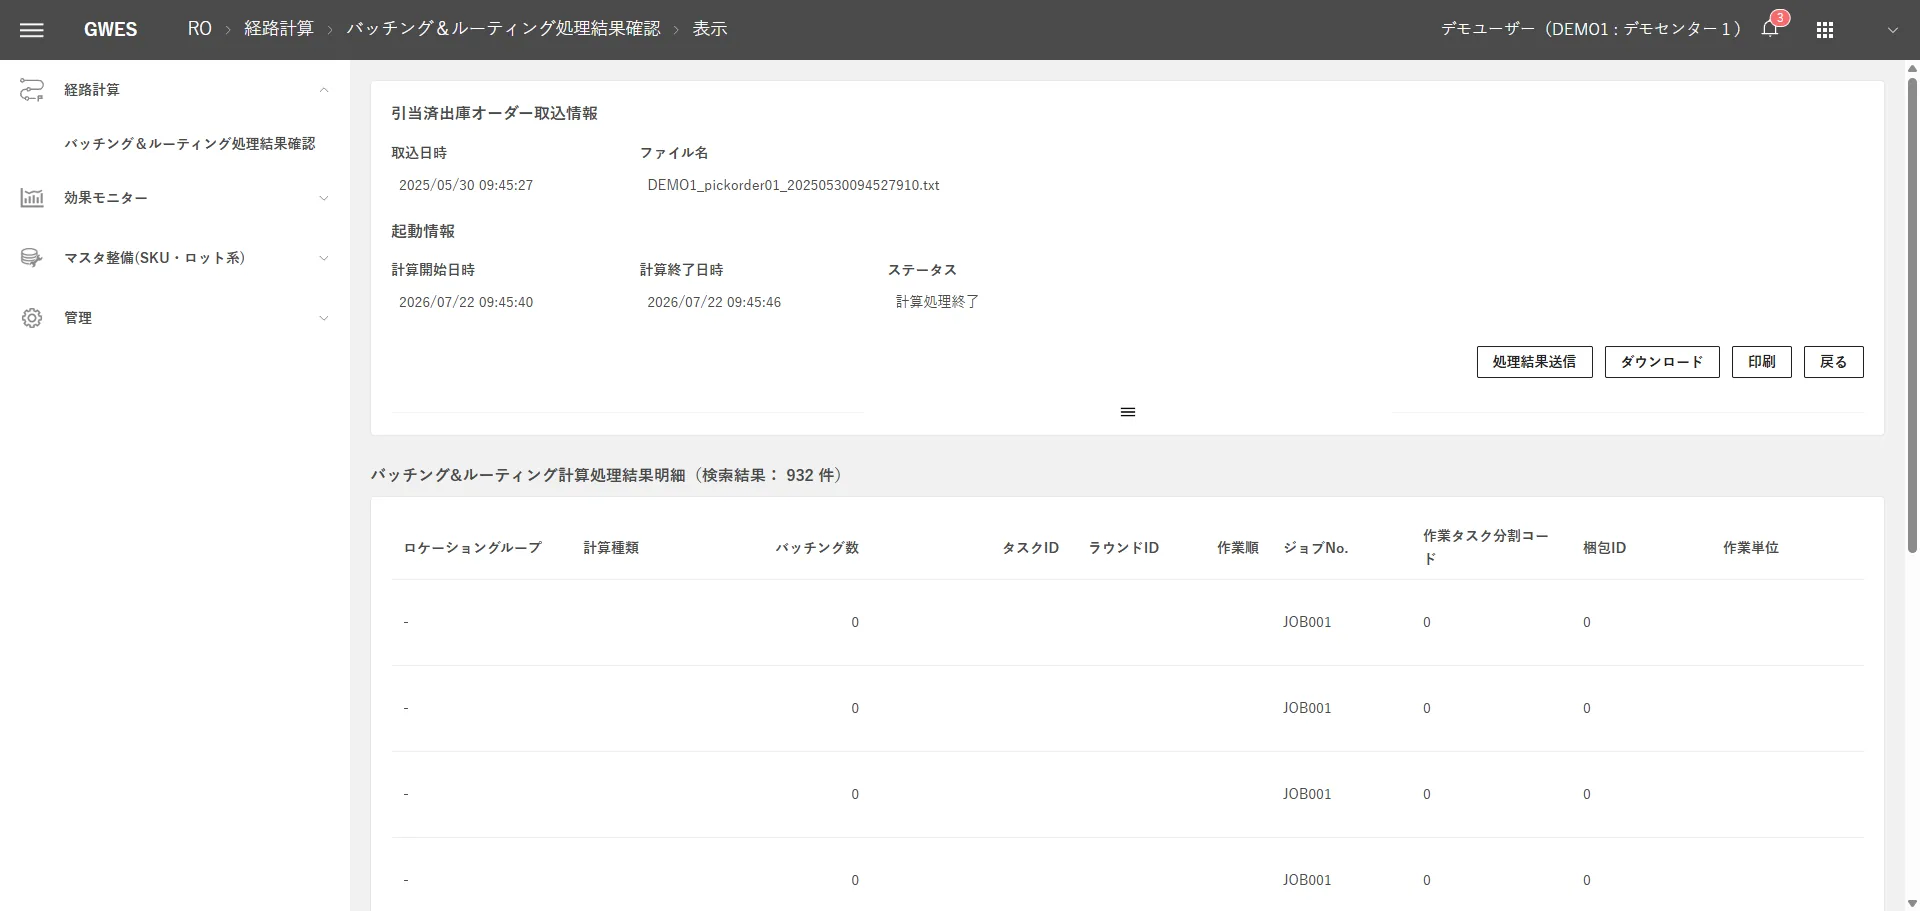
SO operations consist of four main phases.
Phase 1
Initial Setup
- Set up basic center information
Phase 2
Trend Analysis
- Run outbound trend calculations
Phase 3
Optimization Calculation
- Run relocation calculations
Phase 4
Impact Review
- Check the inventory placement matrix
Prepare master settings and location information in advance, analyze outbound trends to calculate SKU ranks, run optimization calculations to instruct relocation, replenishment, and putaway, and keep the improvement cycle turning with impact reviews.
03Features
Key Features
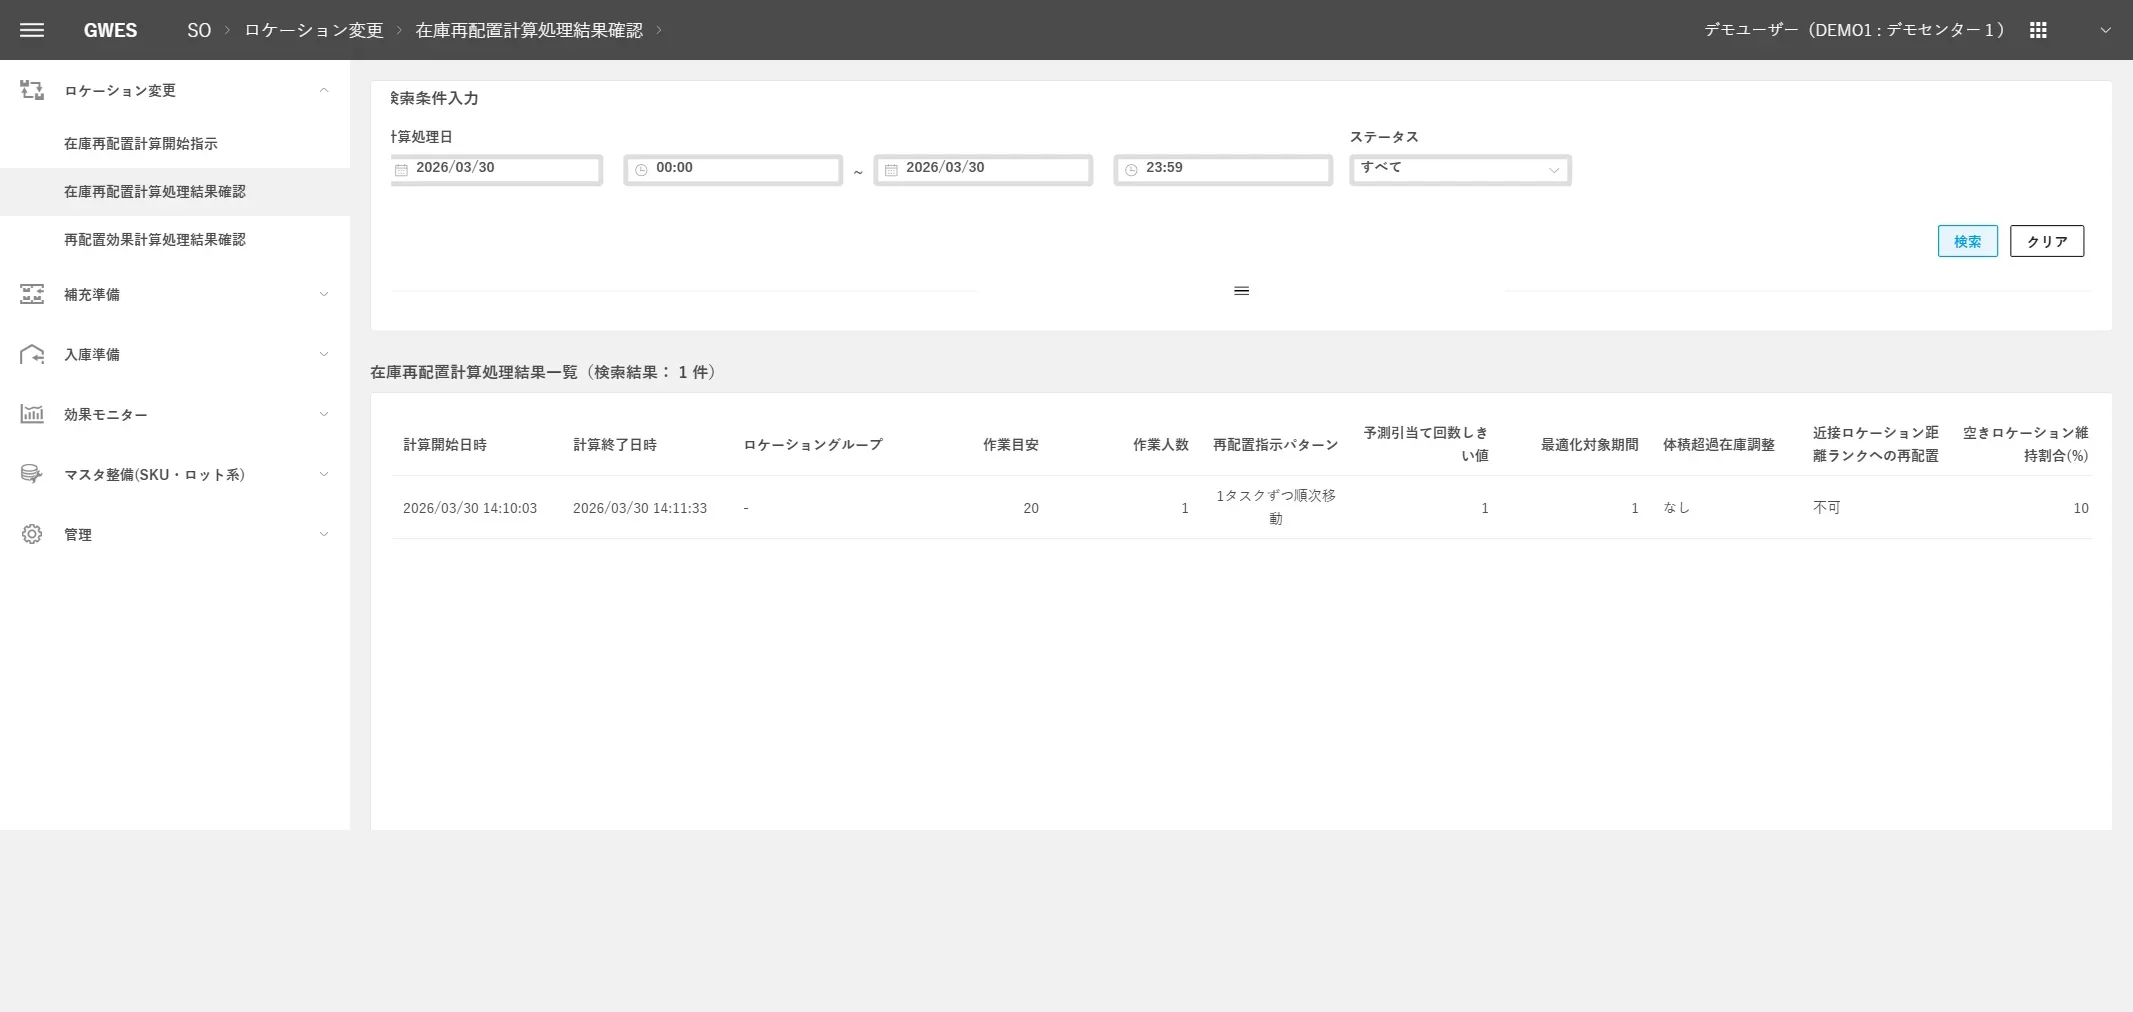
Inventory Relocation Calculation Results Location Changes
Calculate, execute, and review the impact of inventory relocation
Inventory Placement Matrix Impact Monitor
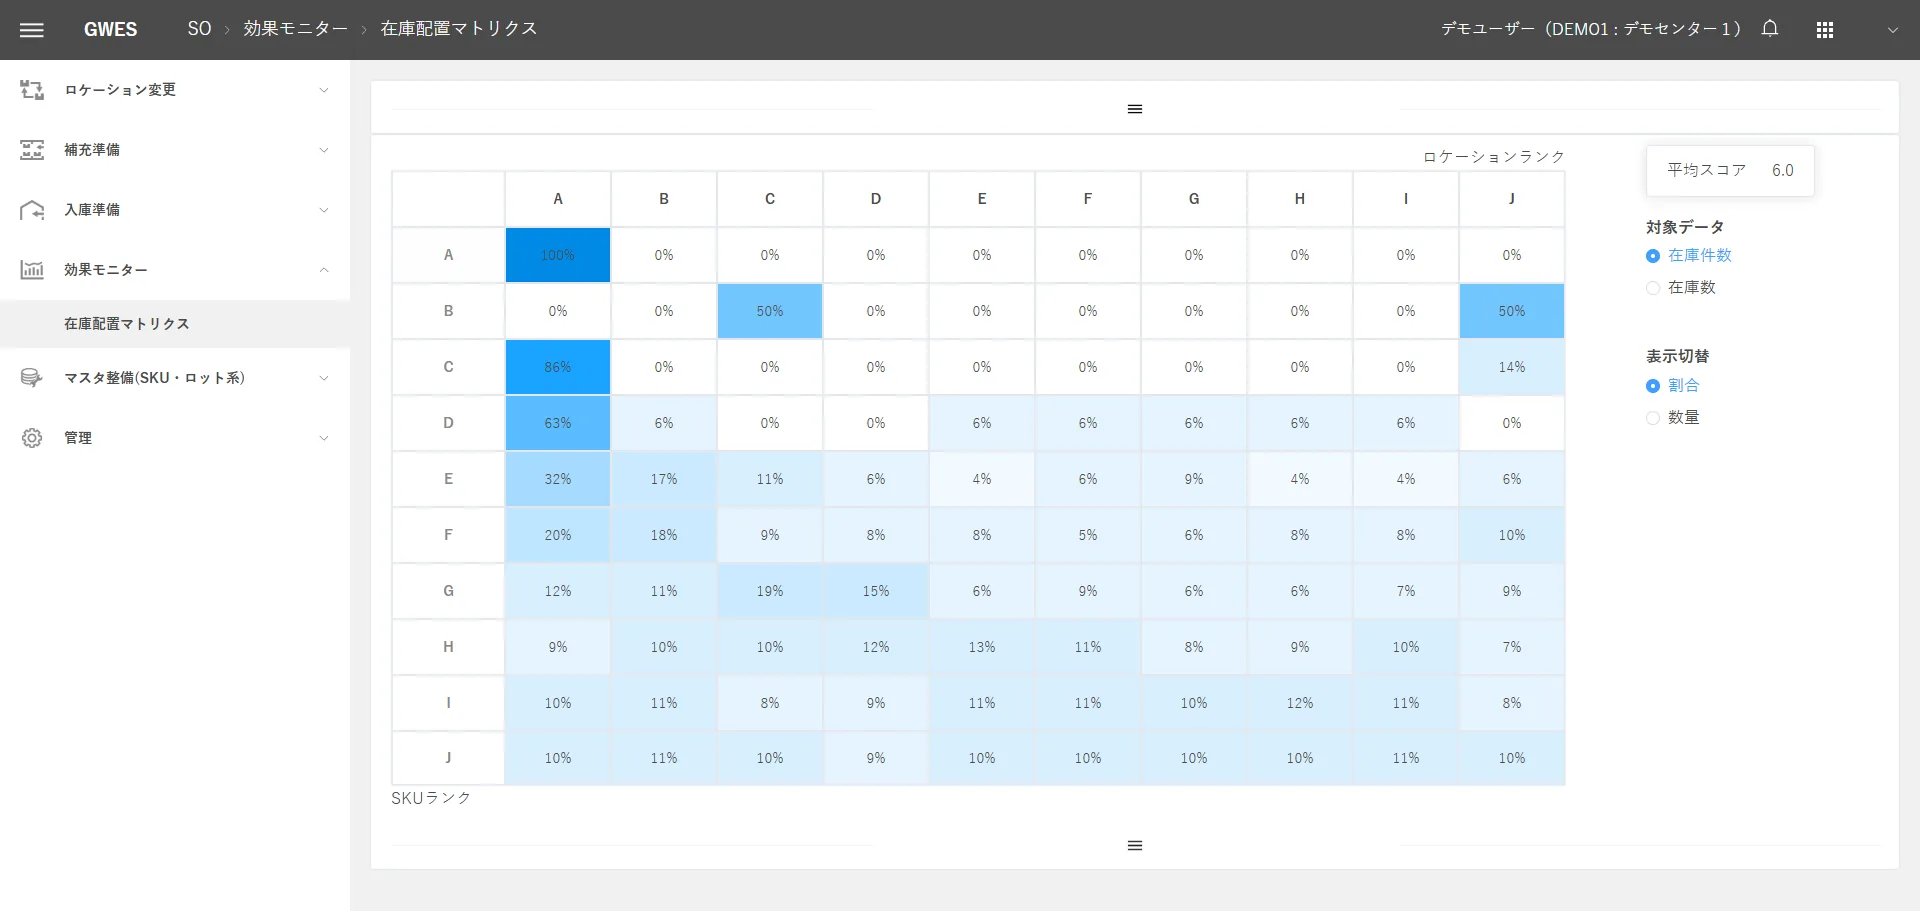
The inventory placement matrix cross-tabulates SKU rank (vertical axis) against location distance rank (horizontal axis) and scores how optimal the current inventory placement is, out of 10 points.
Replenishment Calculation Results Replenishment Prep
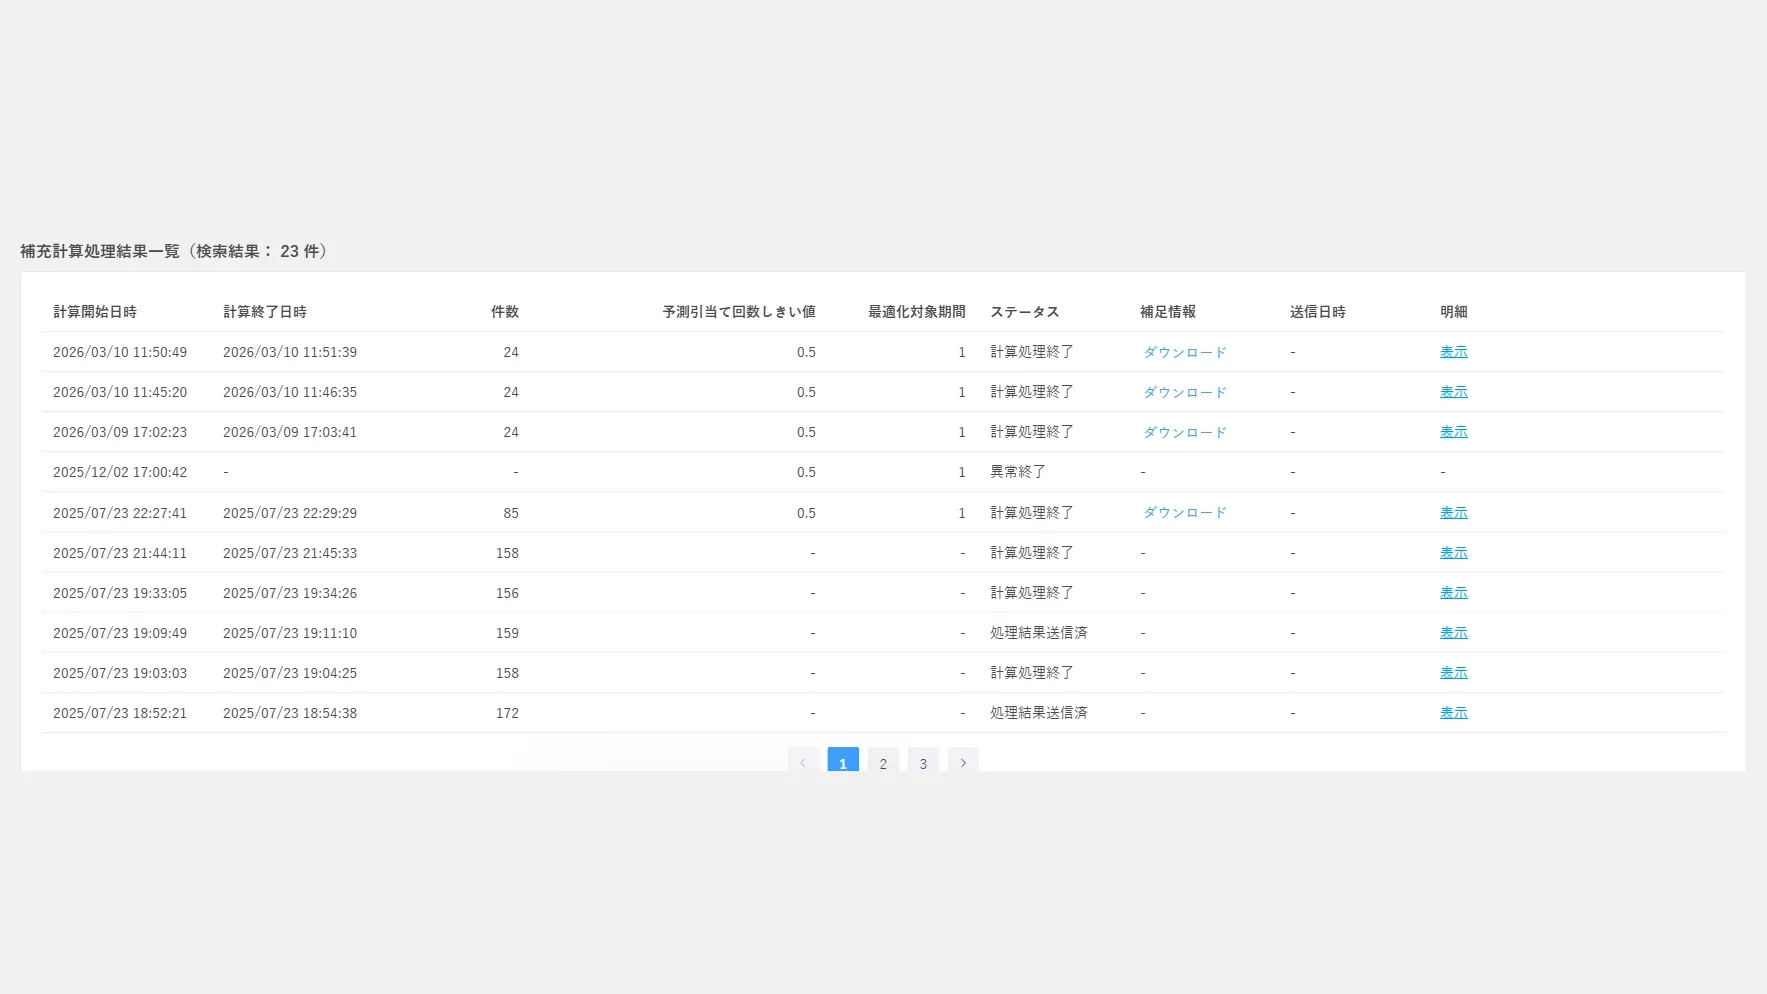
Optimal instructions for replenishment from storage locations to pick locations
Putaway Prep
Putaway destination instructions that keep placement optimal
Master Data Upkeep (SKU, Lot)
SKU rank calculation, reorder point management, and master data upkeep
Tap the image to open its description
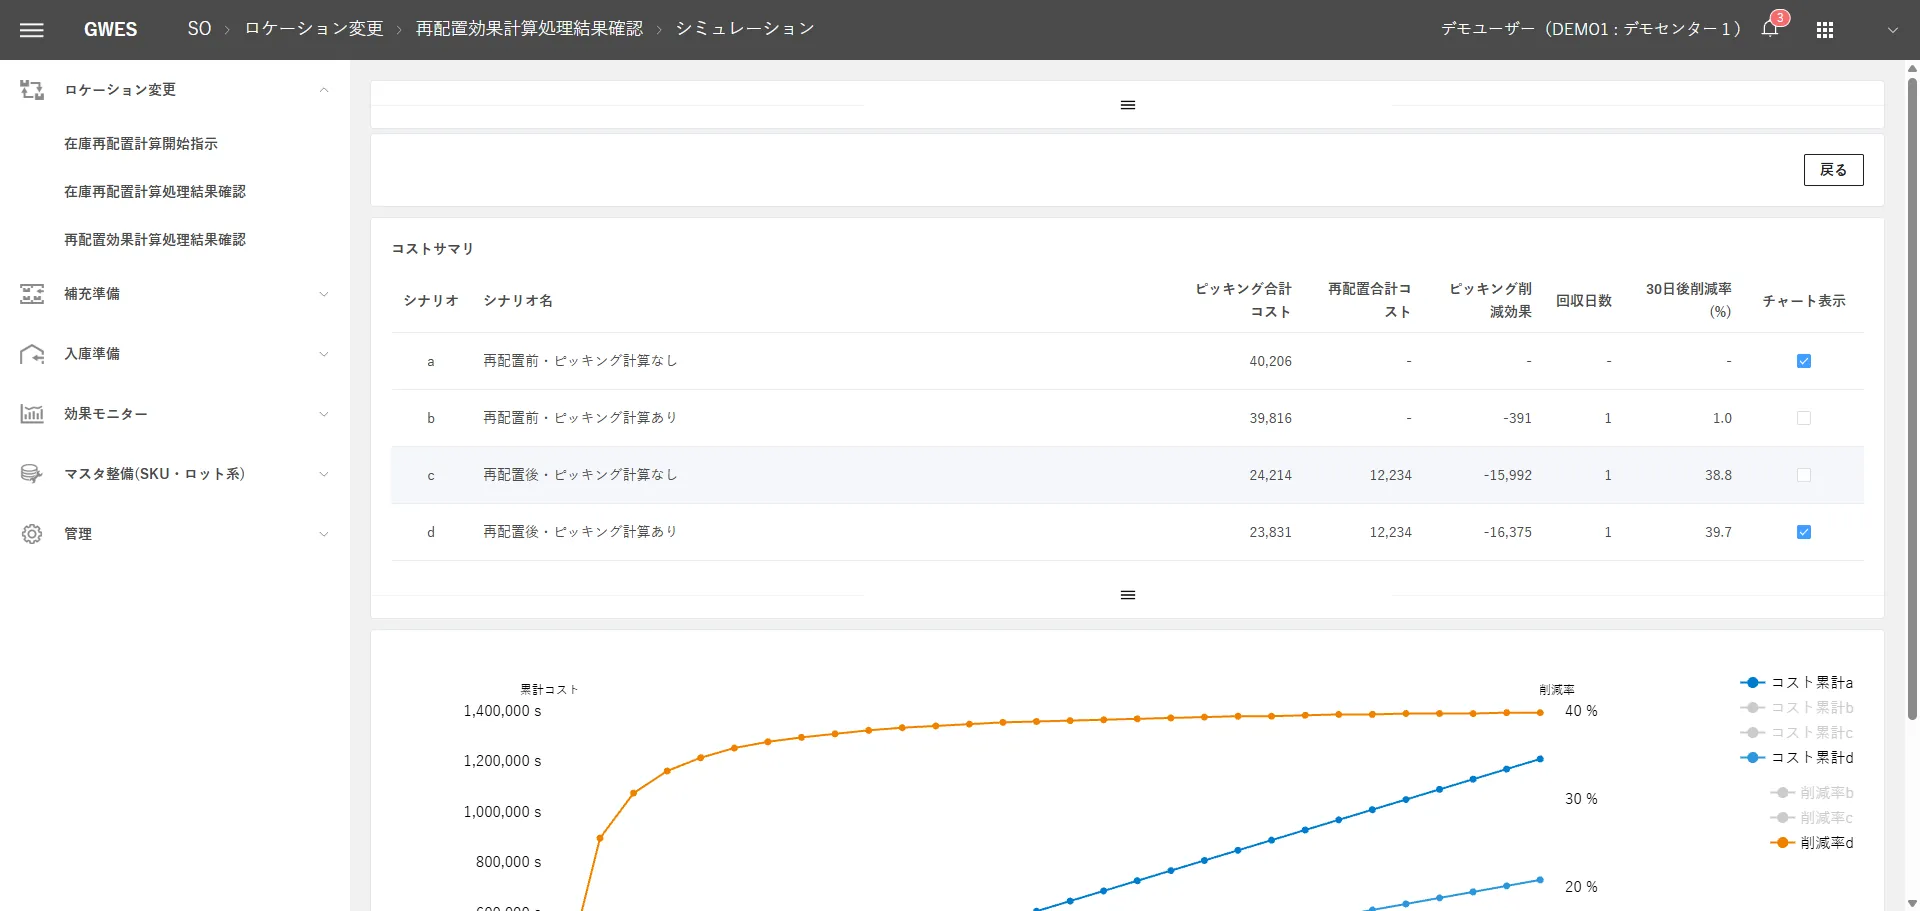
Four-Scenario Comparison of Relocation Impact
Compares picking costs across the four scenarios below to clarify how much each module contributes.
| Scenario | SO | RO | Expected impact |
|---|---|---|---|
| Current (baseline) | No | No | Current cost level |
| RO only | No | Yes | Effect of path optimization only |
| SO only | Yes | No | Effect of placement optimization only |
| SO + RO together | Yes | Yes | Largest savings (synergy) |
04Modules
Other GWES Modules
Visualization & Analysis




Optimization



Infrastructure



FIRST STEP
See where you stand with a free GPIM assessment
We clarify which level your logistics facility is at now and what to do next.