
MODULE PA
Work Progress Analysis
Progress Analyzer (PA)
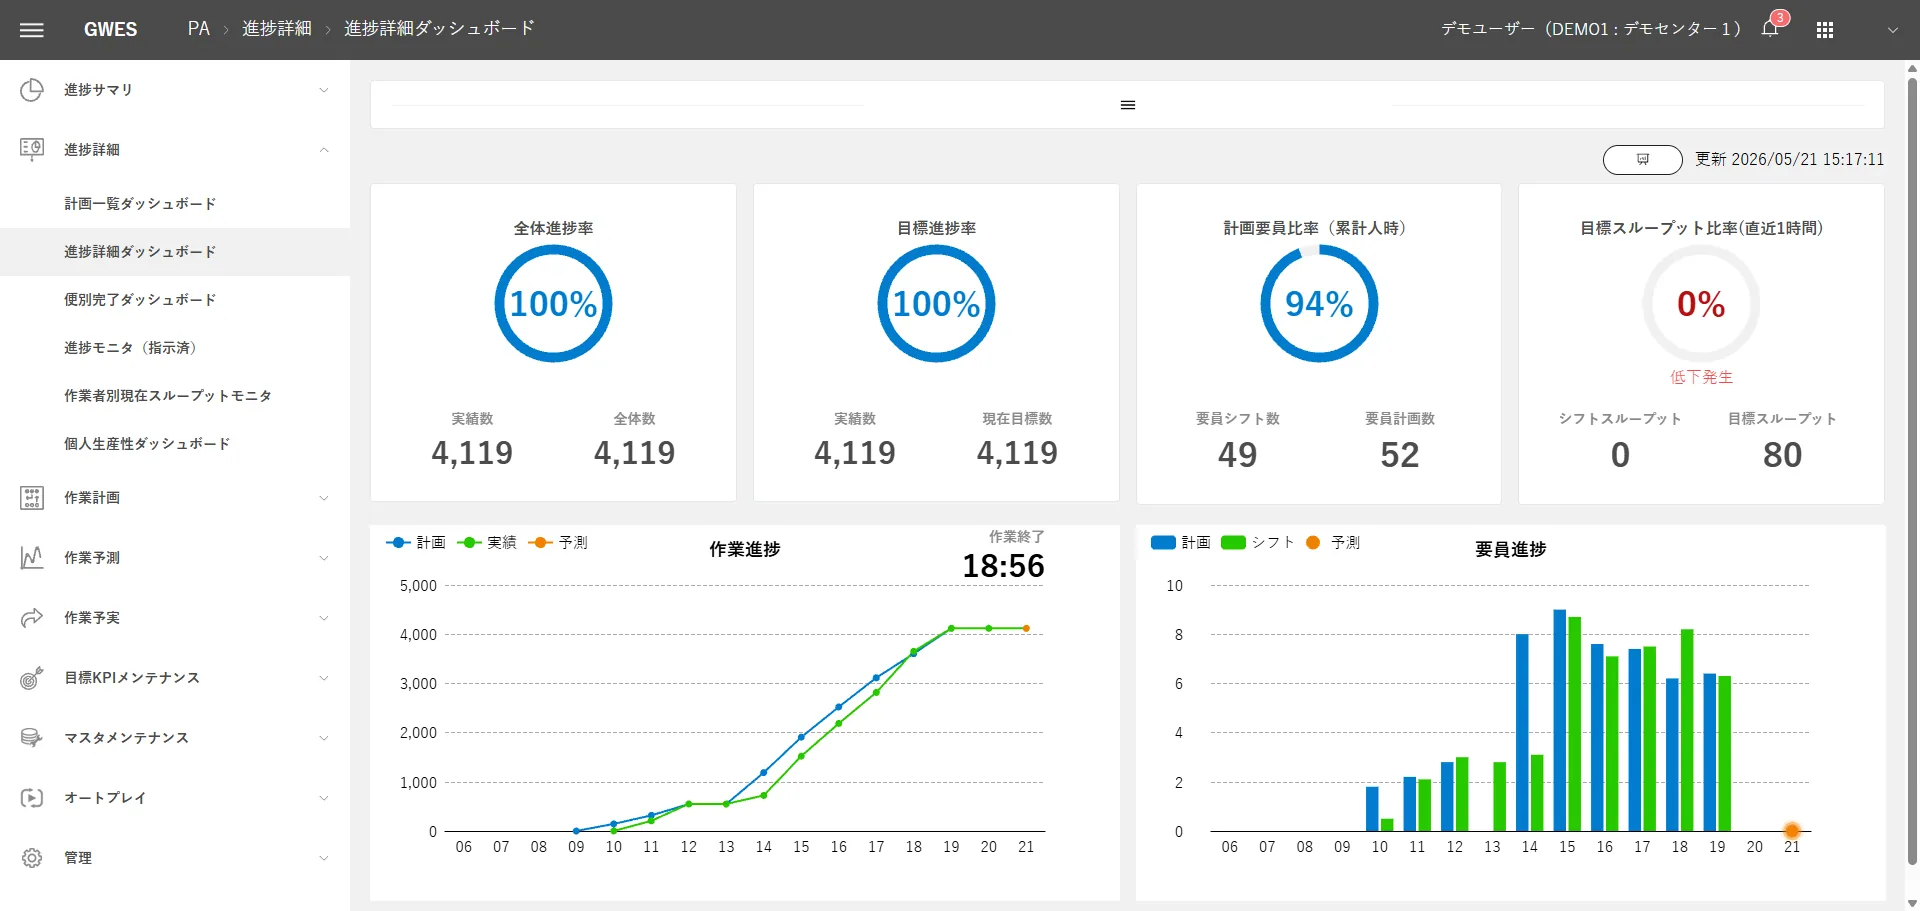
Shows progress against the plan as it happens. Consists of 6 categories and 31 screens.
Tap the image to open its description
01About
Overview

PA combines workload data from the WMS (warehouse management system) with target KPIs to monitor real-time progress in receiving, putaway, picking, and shipping in one place. Its goal is to make progress management, which used to rely on scheduled progress reports and floor walks, data-driven.
Challenges PA Solves
No real-time view of progress
Reliance on scheduled progress reports delays the detection of problems. By the time a problem surfaces, it is already too late, and the response falls behind.
Falling cutoff compliance by shipment
Progress against each shipment's cutoff time is not visible, so the risk of missing it cannot be seen in advance. Delays and shipping errors follow.
Slow staffing decisions
The workload balance across processes is not visible, so decisions to reallocate resources depend on floor leaders' intuition and experience.
02Workflow
Operational Flow
- 1
Data comes in
WMS workload data and target KPIsWMS workload data and target KPIs
- 2
Seen on screen
Progress in 4 processes vs. plan and forecast4-process progress vs. plan and forecast
- 3
Spot issues
Instantly detect delays and cutoff risksInstantly detect delays and cutoff risks
- 4
Take action
Decide on staffing and reallocationDecide on staffing and reallocation
- 5
Results change
Cutoffs met and next-day improvementCutoffs met and next-day improvement
PA operations consist of four main phases.
Phase 1
Initial Setup
- Set target KPIs
Phase 2
Start of Shift
- Check the plan overview dashboard
Phase 3
During the Day
- Monitor overall and per-floor progress
Phase 4
After the Shift
- Hourly work results summary
Set KPIs and master data in advance, review the day's plan at the start of the shift, monitor progress in real time during the day to catch delays instantly, and after the shift analyze plan versus actual to improve the days that follow.
03Features
Key Features
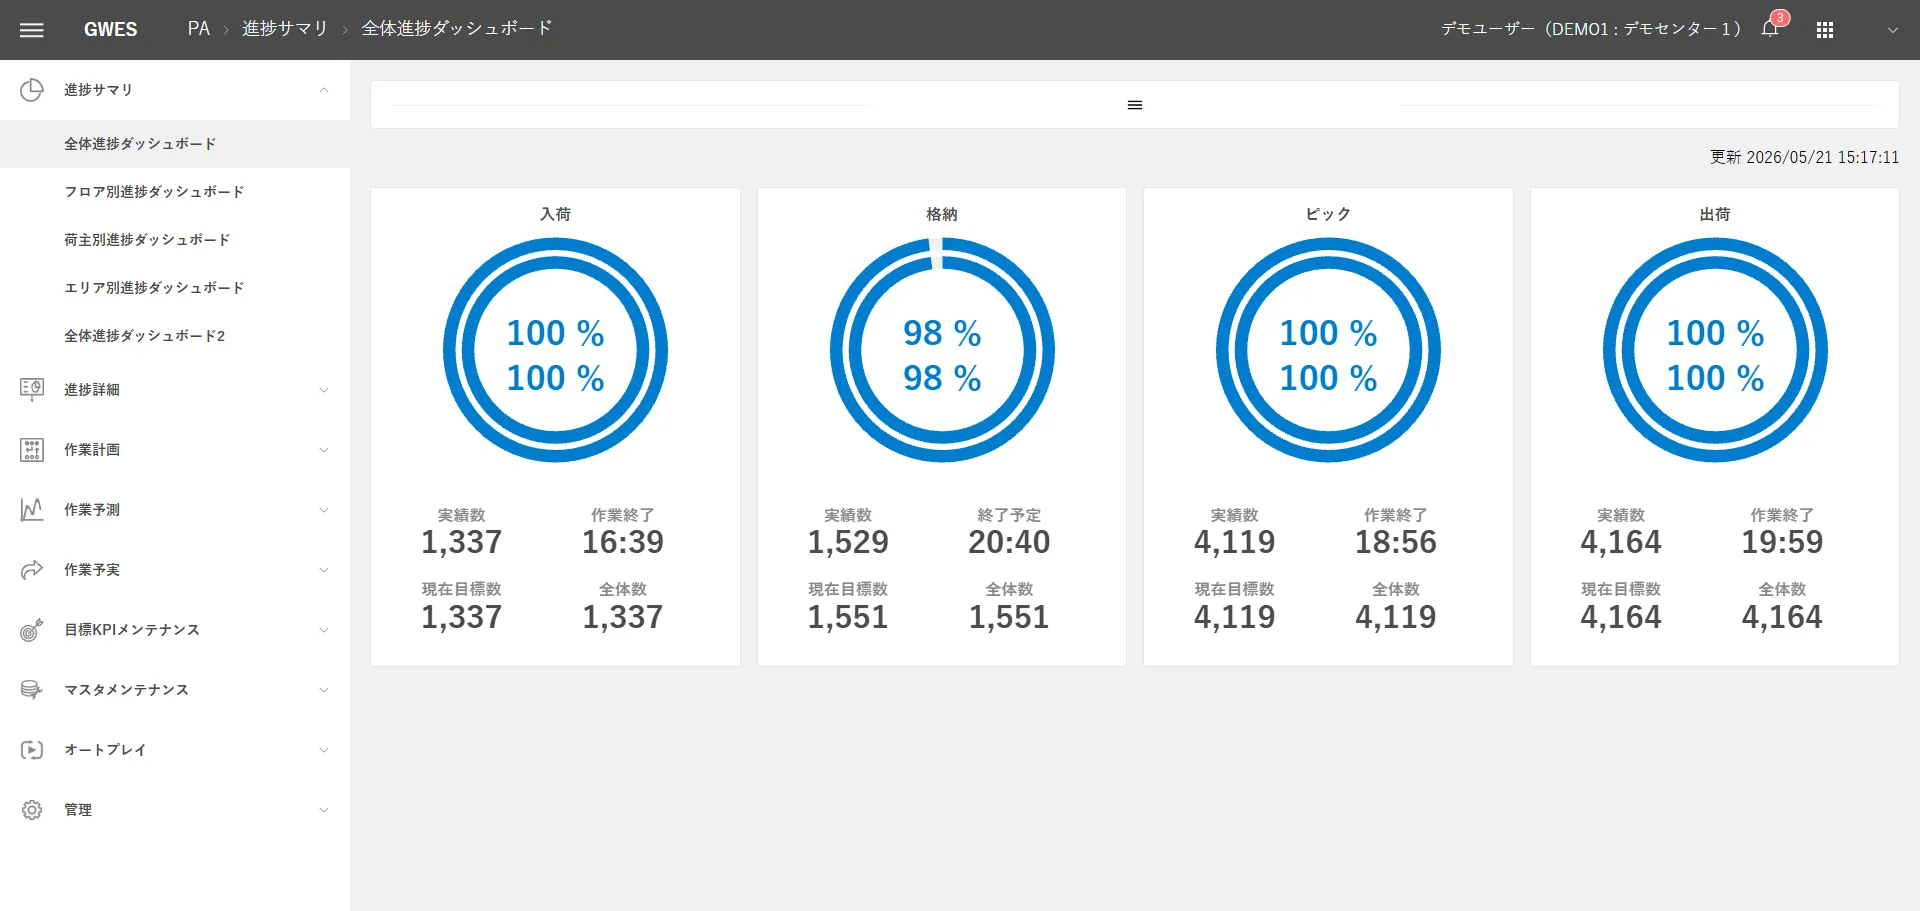
Overall Progress Dashboard Progress Summary
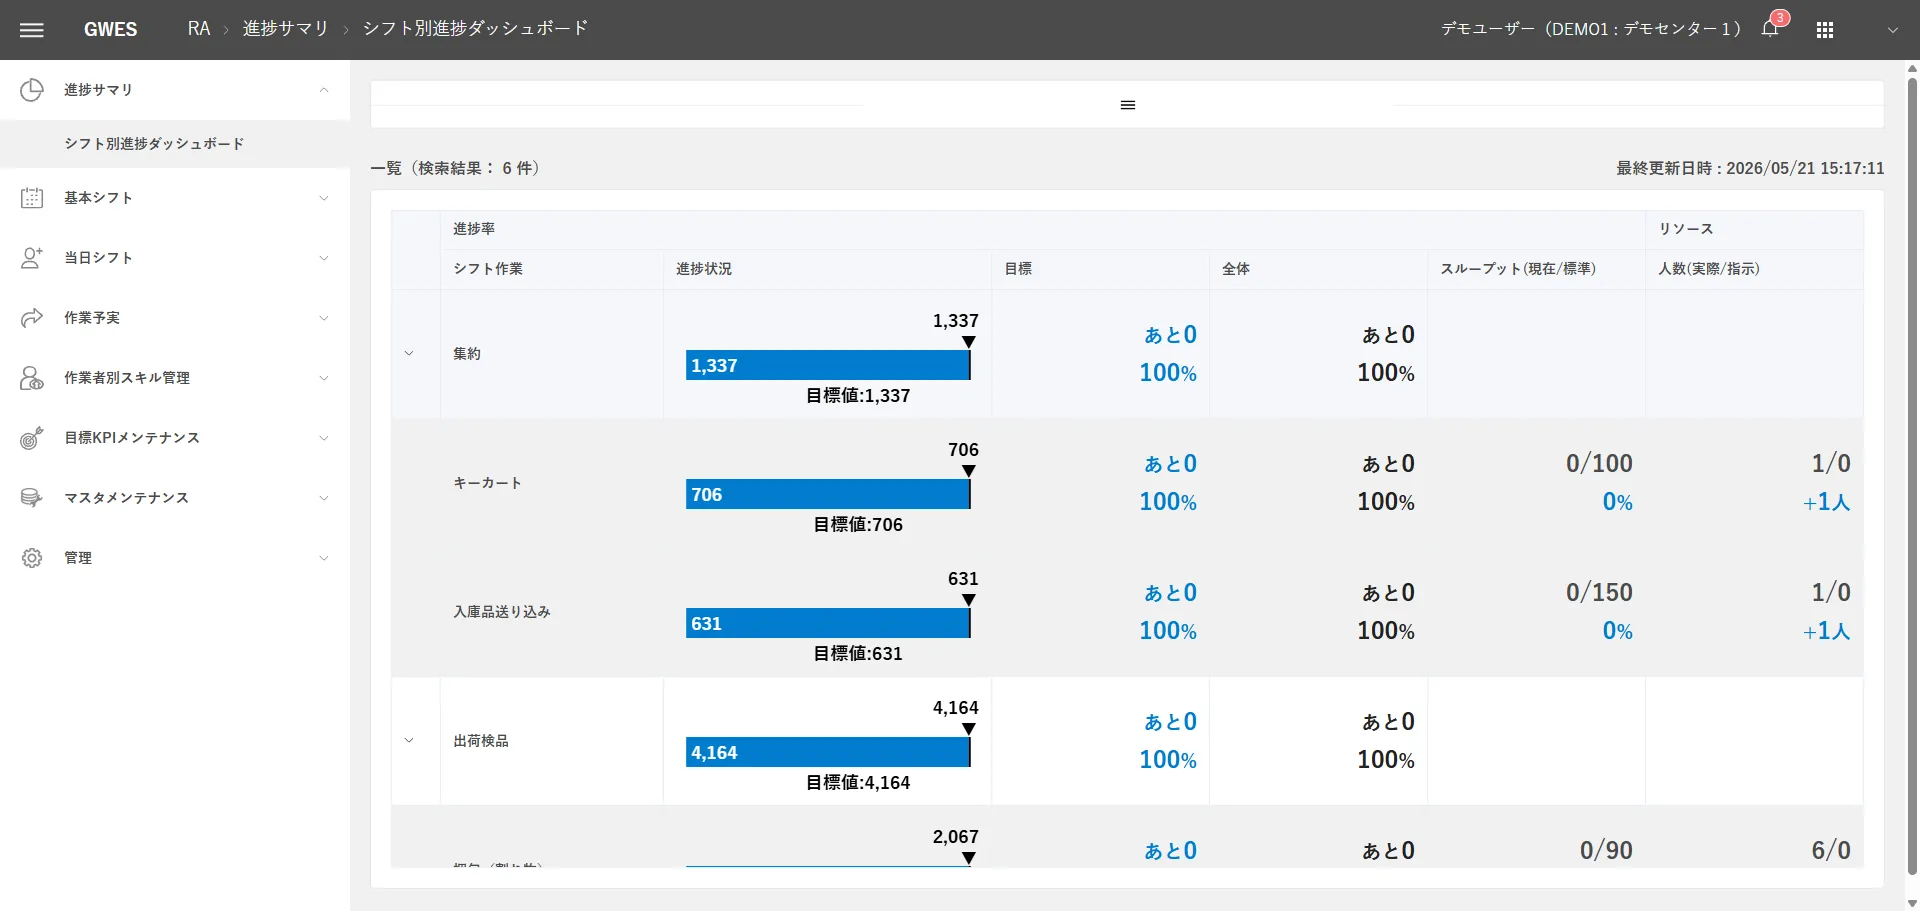
Progress Summary is a set of dashboards for a real-time overview of work progress across the whole warehouse. It shows receiving, putaway, picking, and shipping in pie charts from four angles: overall, by floor, by shipper, and by area.

Progress Monitor (Instructed) Progress Details
A set of screens for detailed analysis after Progress Summary detects an anomaly. KPI cards, line charts (comparing three lines: plan, actual, and forecast), progress by shipment, throughput monitors, and more allow analysis from multiple angles.
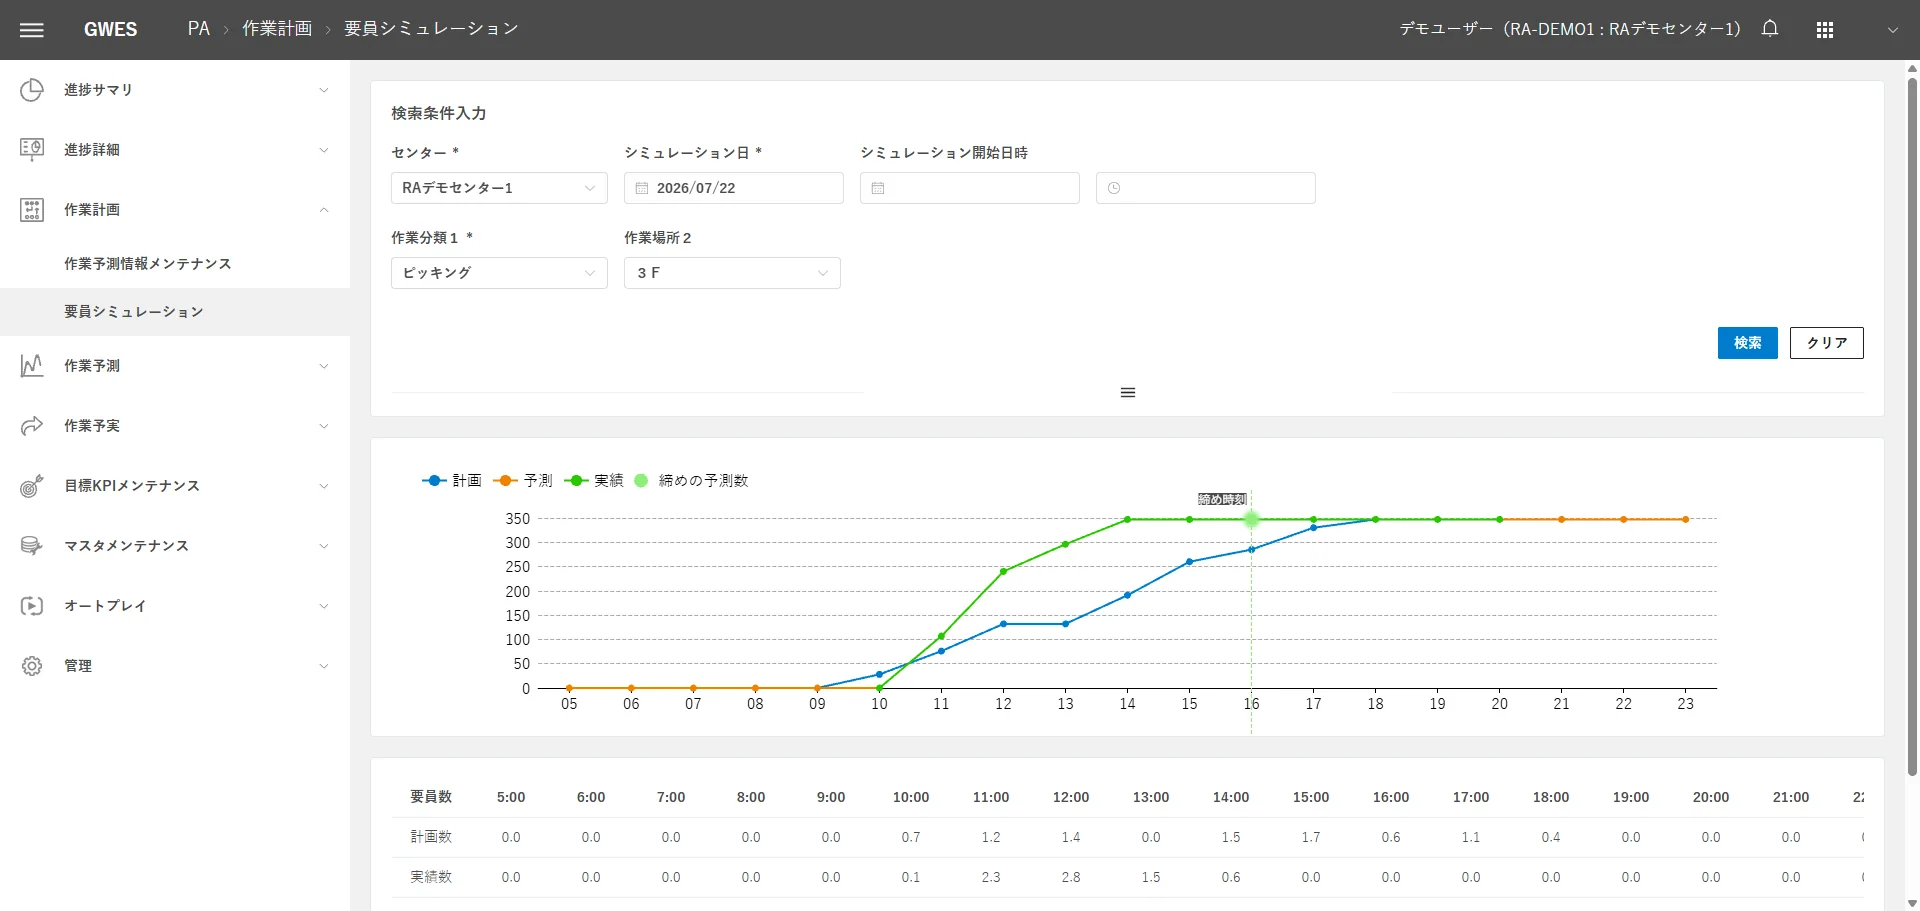
Staffing Simulation Work Planning
PA's work planning and forecasting features forecast future workload from historical results and simulate appropriate staffing. They support not only “today's progress” but also “preparing for tomorrow and beyond.”
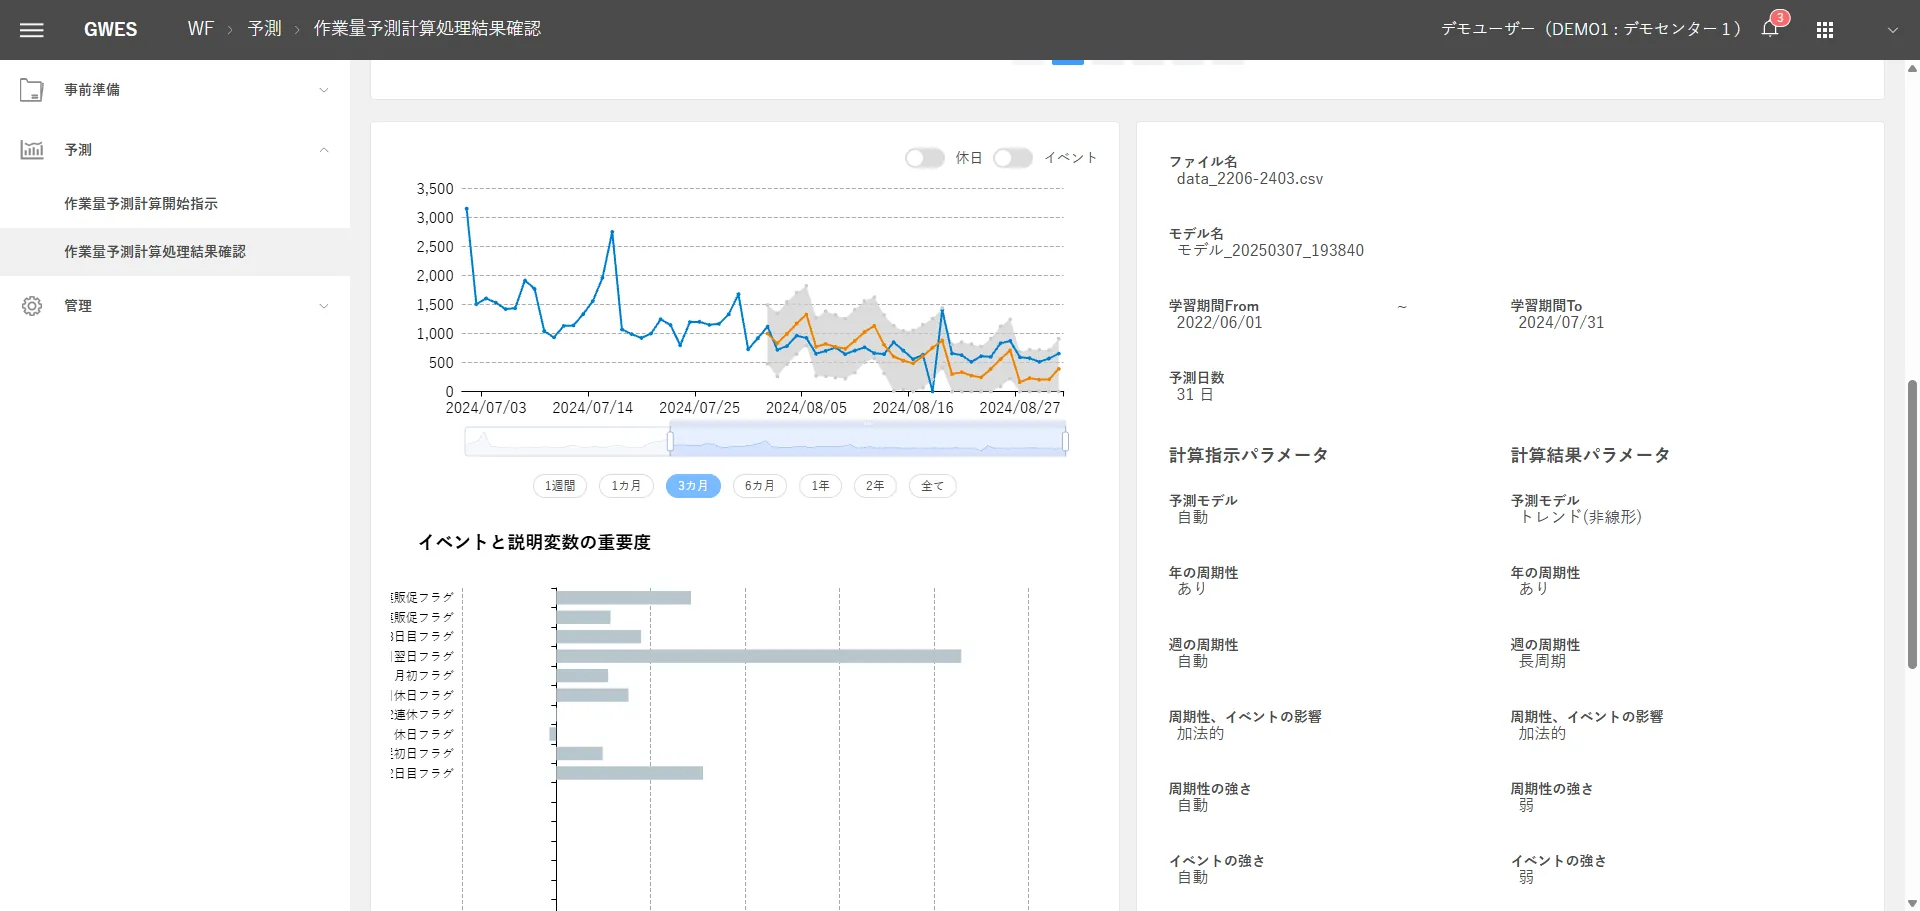
Work Forecasting
A set of features that statistically forecasts future workload from historical work results. It supports the whole workflow, from building forecast models to reviewing results.
Plan vs. Actual Analysis
A set of screens for analyzing results after the shift. It analyzes gaps between plan and actual by hour and by day to improve operations from the next day on.
Tap the image to open its description
Using the Progress Summary Views
Drill down in this order: overall progress → grasp the big picture → by floor → pinpoint delayed floors → by shipper/by area → dig into the causes. For 3PLs, the by-shipper view matters most; for in-house logistics, the by-area view does.
04Modules
Other GWES Modules
Visualization & Analysis

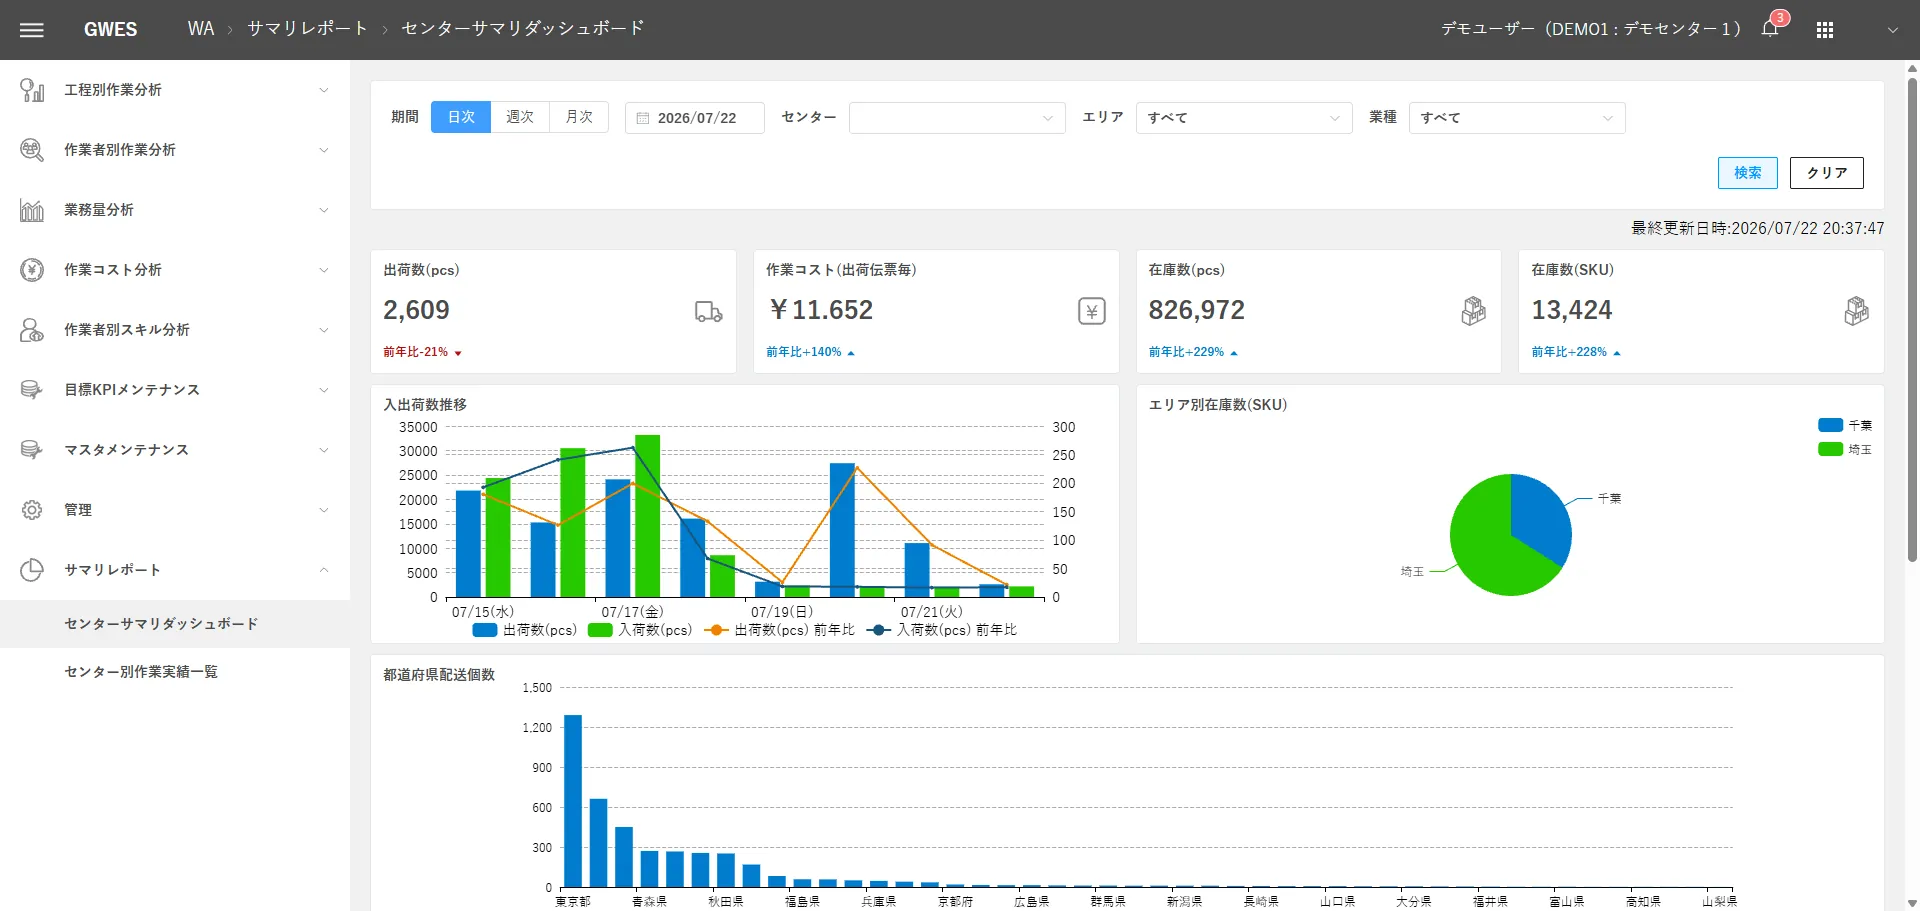

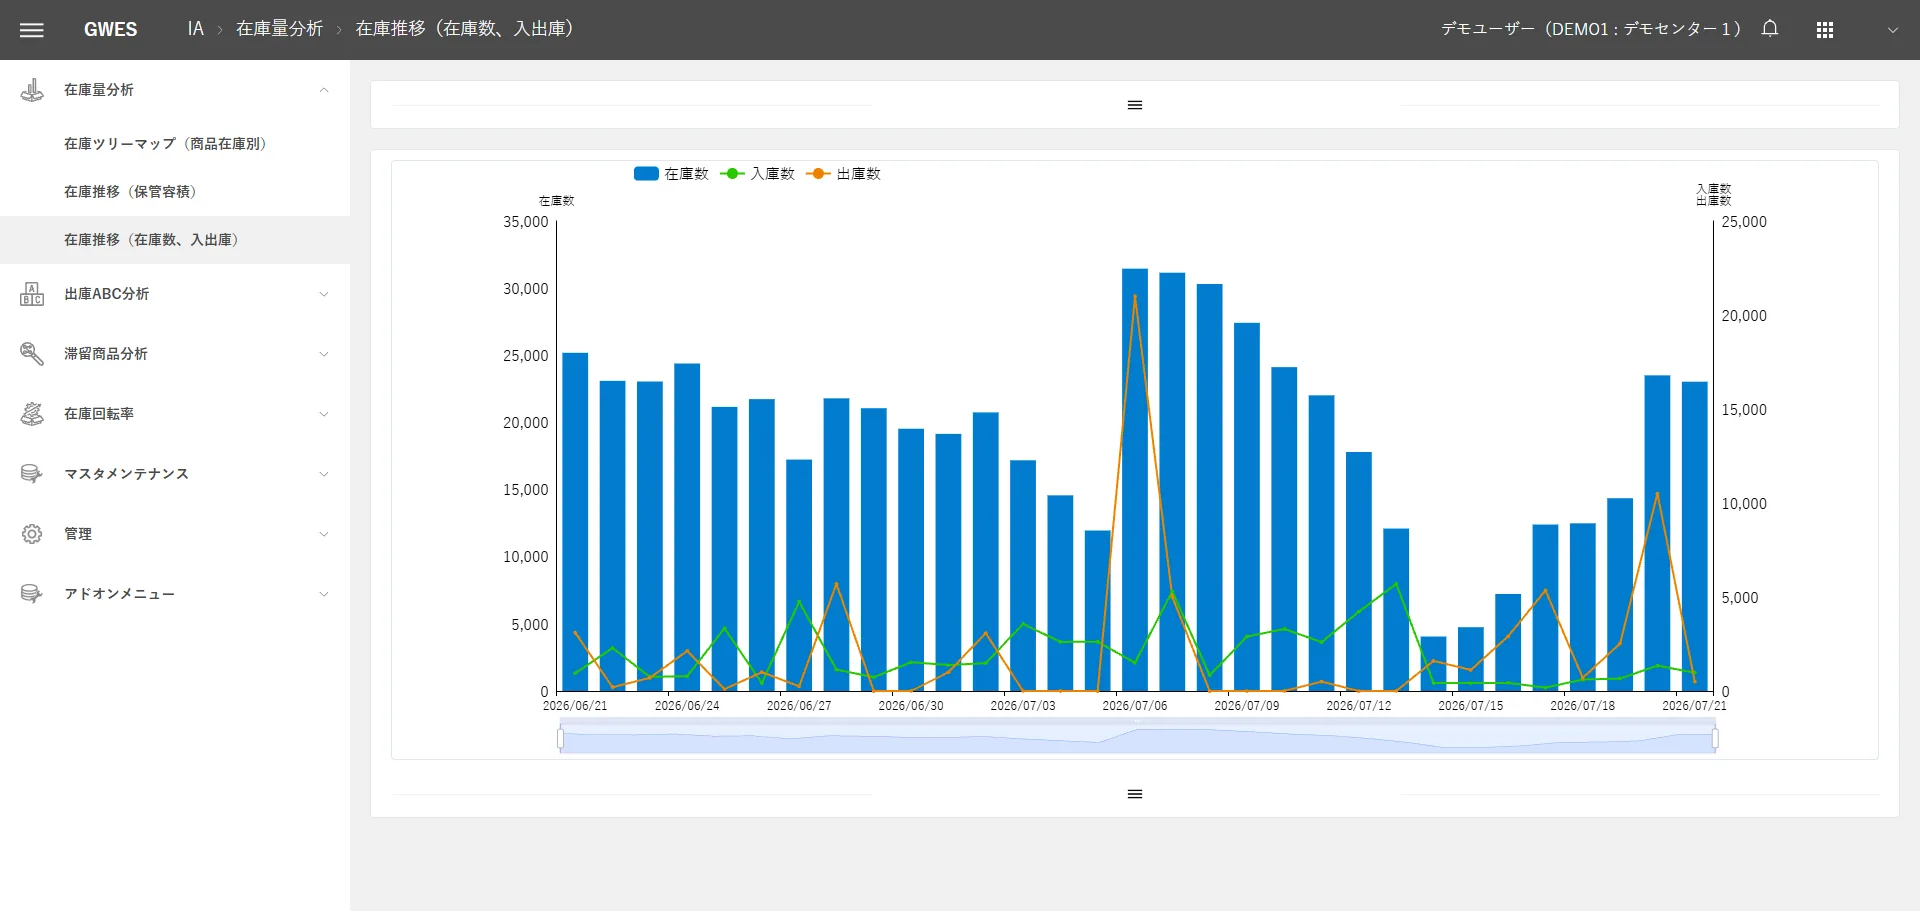

Optimization
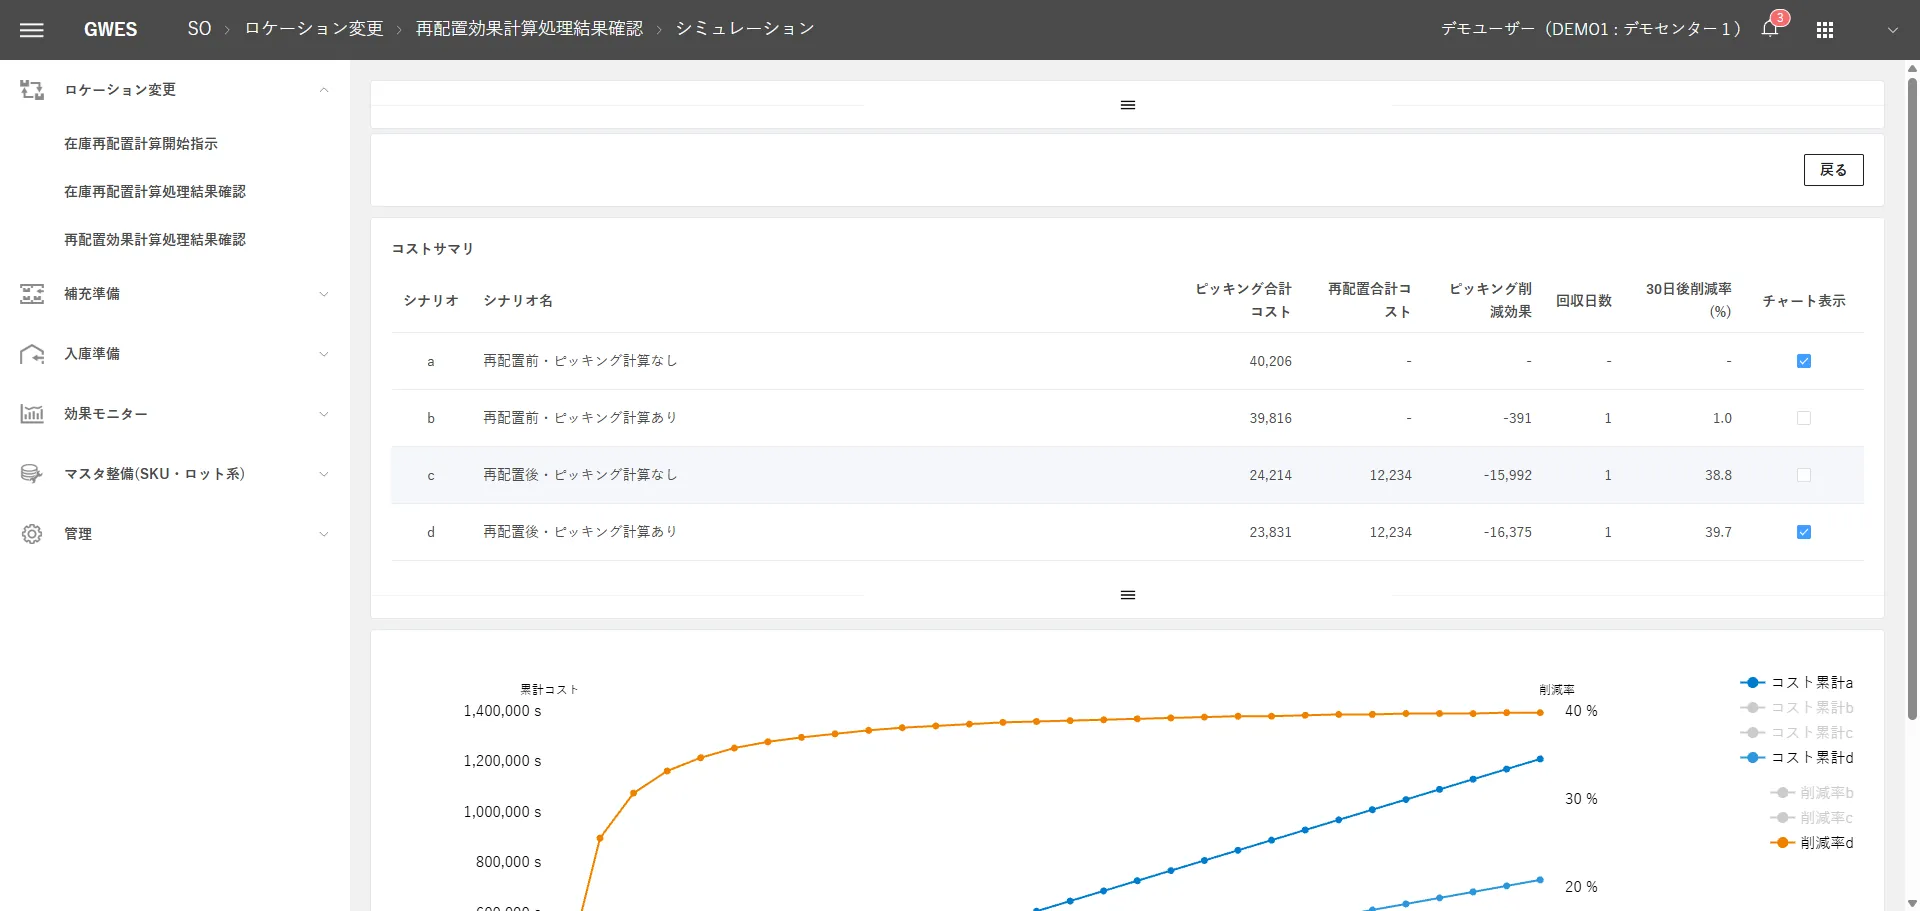

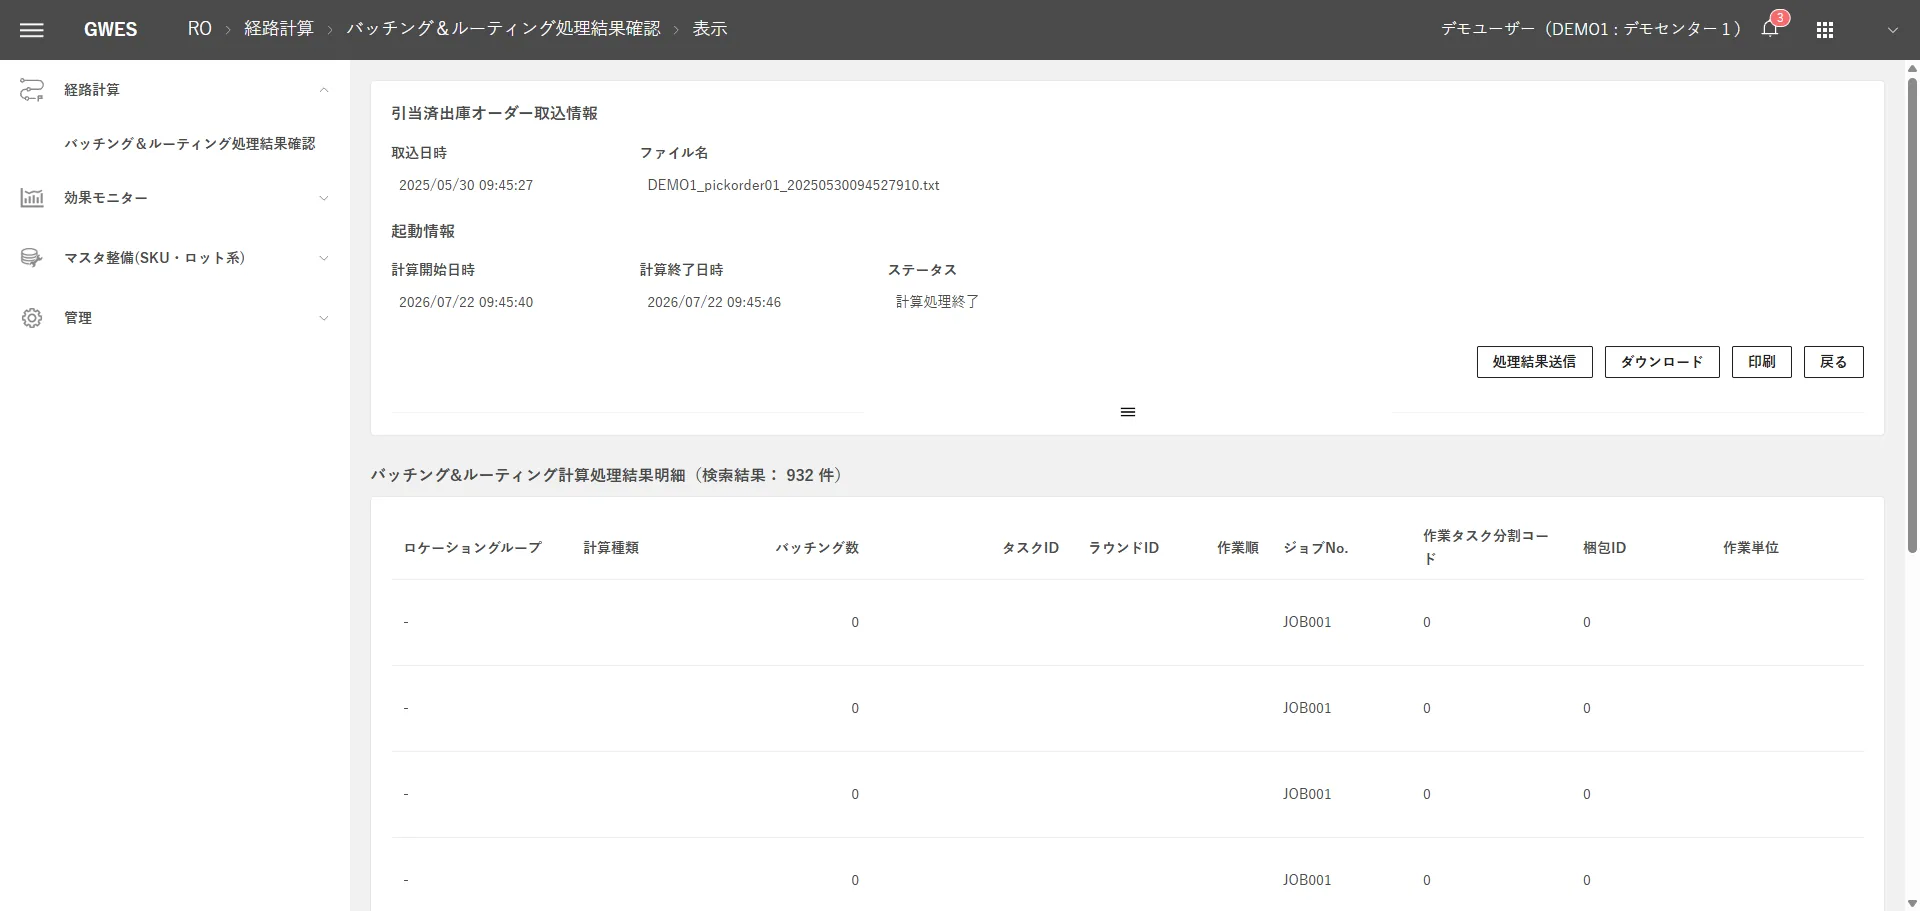



Infrastructure



FIRST STEP
See where you stand with a free GPIM assessment
We clarify which level your logistics facility is at now and what to do next.