
MODULE RO
Batching & Routing Optimization
Routing Optimizer (RO)
Arranges picking paths and task order into the shortest routes.

Tap the image to open its description
01About
Overview
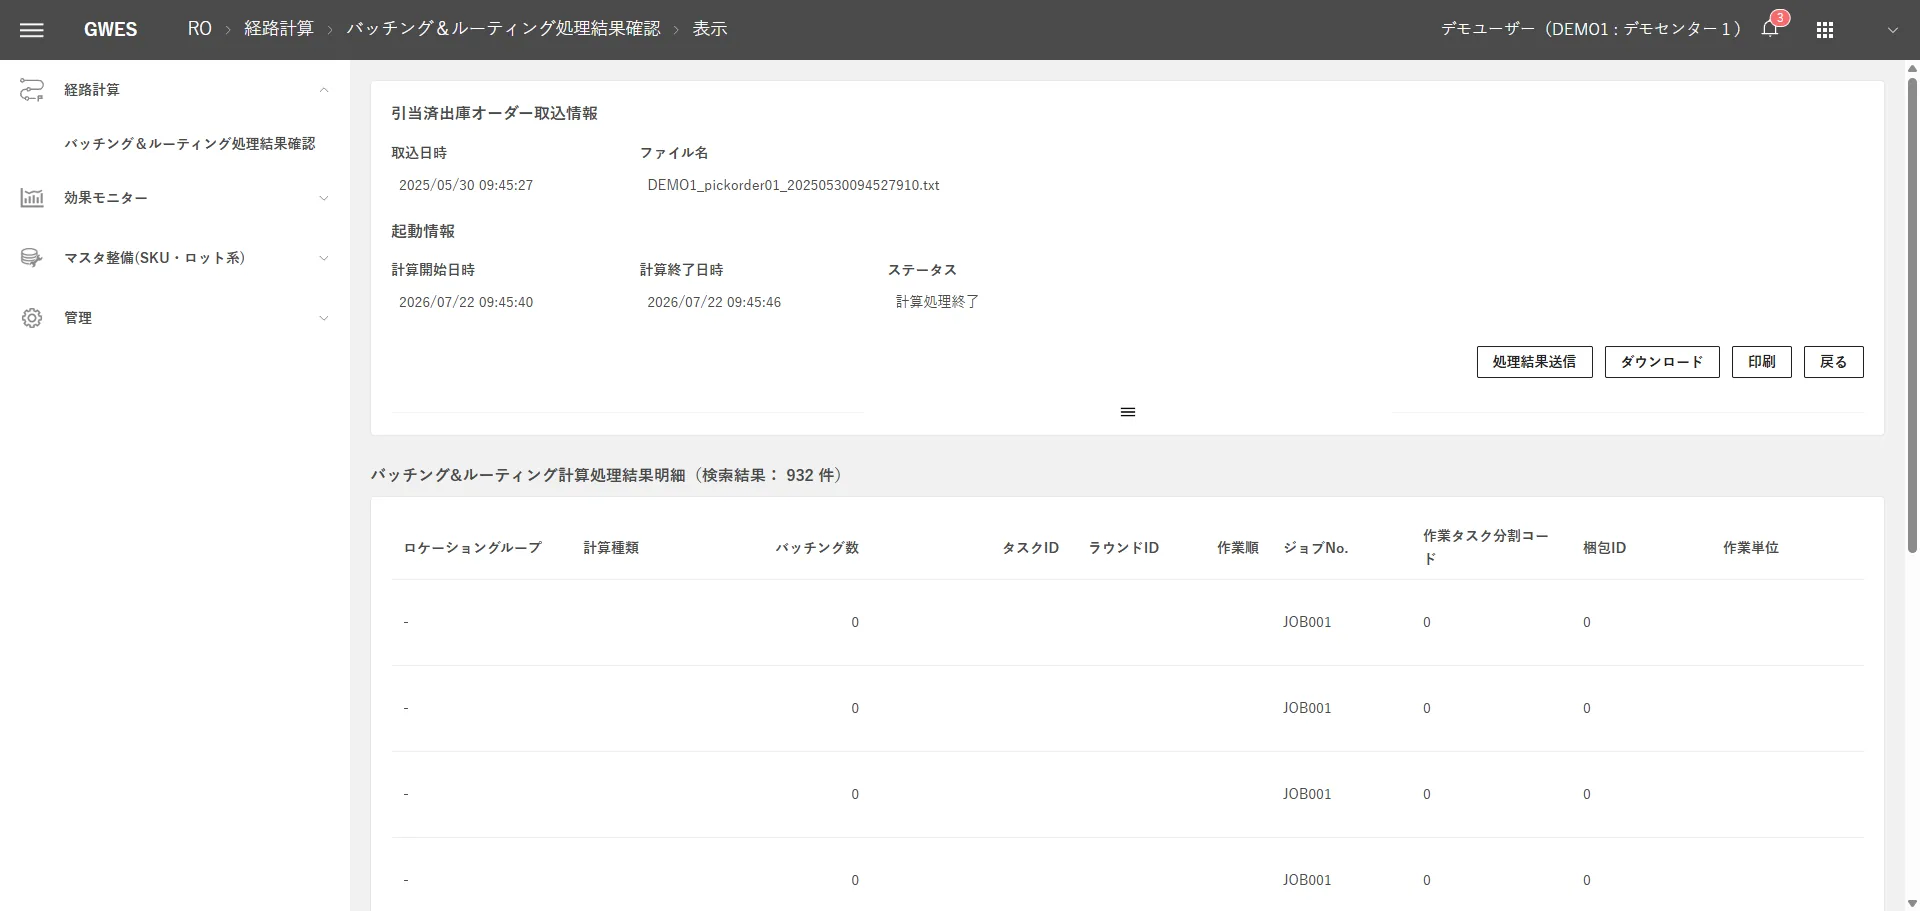
RO optimally assigns multiple orders to multiple pickers (batching) and minimizes each picker's walking path (routing), greatly improving picking efficiency in distribution centers.
Three Challenges RO Solves
Inefficient order assignment
Manual assignment skews pick areas, and the load piles up on certain pickers. Overall completion time grows longer.
Wasted walking distance
WMS pick instructions tend to follow shelf-number order, which causes detours in the actual layout.
Invisible improvement effects
Even after path improvements, the actual reduction in walking distance and time cannot be quantified, which makes return on investment hard to judge.
02Workflow
Operational Flow
- 1
Data
Order data and warehouse mapsOrder data and warehouse map data
- 2
Calculate
RO calculates batching & routingRO calculates batching and routing
- 3
Instructions on screen
Rounds and pick order for each pickerRounds and pick order for each picker
- 4
Work as instructed
Pick with optimized pick instructionsPick with optimized pick instructions
- 5
Impact
Less walking, better efficiencyLess walking and time, better efficiency
Picking path optimization with RO has four phases, from map data preparation through batching and routing to impact review.
Phase 1
Map Data Preparation
- Create the warehouse layout in Map Editor (ME)
Phase 2
Batching
- Receive order data from the WMS
Phase 3
Routing
- Calculate the shortest paths with a TSP approximation algorithm
Phase 4
Impact Review
- Track the improvement in the RO Impact Monitor
RO works together with the WMS. It receives order data from the WMS and returns optimized pick instructions to it, so it can be introduced without major changes to existing workflows.
03Features
Key Features

Batching & Routing Results Batching
Optimally assigns multiple orders to multiple pickers. Using combinatorial optimization, it groups orders so that each picker's pick areas are close together, evening out and minimizing walking distance at the same time.

Batching & Routing Impact Monitor RO Impact Monitor
Visualizes how much paths improve compared with WMS pick instructions. It compares processing time before and after applying RO in daily bar charts and shows the trend with a trend line. It also displays the reduction rate and the averages before and after, so you can quantify the impact of adoption.

Batching & Routing Heat Map (Routes) Heat Maps
Shows walking paths and pick frequency on the warehouse map in shades of color. Frequently passed areas (hot spots) are easy to see at a glance, which helps decisions on revising shelf placement and improving the layout.
Visualizes the pick frequency of each location to identify high-frequency pick areas.
Routing
Calculates the optimal picking route for the orders assigned to each picker.
Round Splitting
Splits rounds by the volume that can be picked in one trip
Realistic plans that account for cart capacity
Heavy Items First
Picks heavy items first for easier stacking
Lower risk of product damage
Tap the image to open its description
What the RO Impact Monitor Shows
The RO Impact Monitor always shows in numbers “how much things improved compared with not using RO.”
With RO
Estimated walking distance on RO-optimized routes
Without RO
Estimated walking distance with standard WMS pick instructions
Actual
Workers' actual walking distance (measured)
Cumulative Comparison
Graphs the improvement for each period
04Modules
Other GWES Modules
Visualization & Analysis
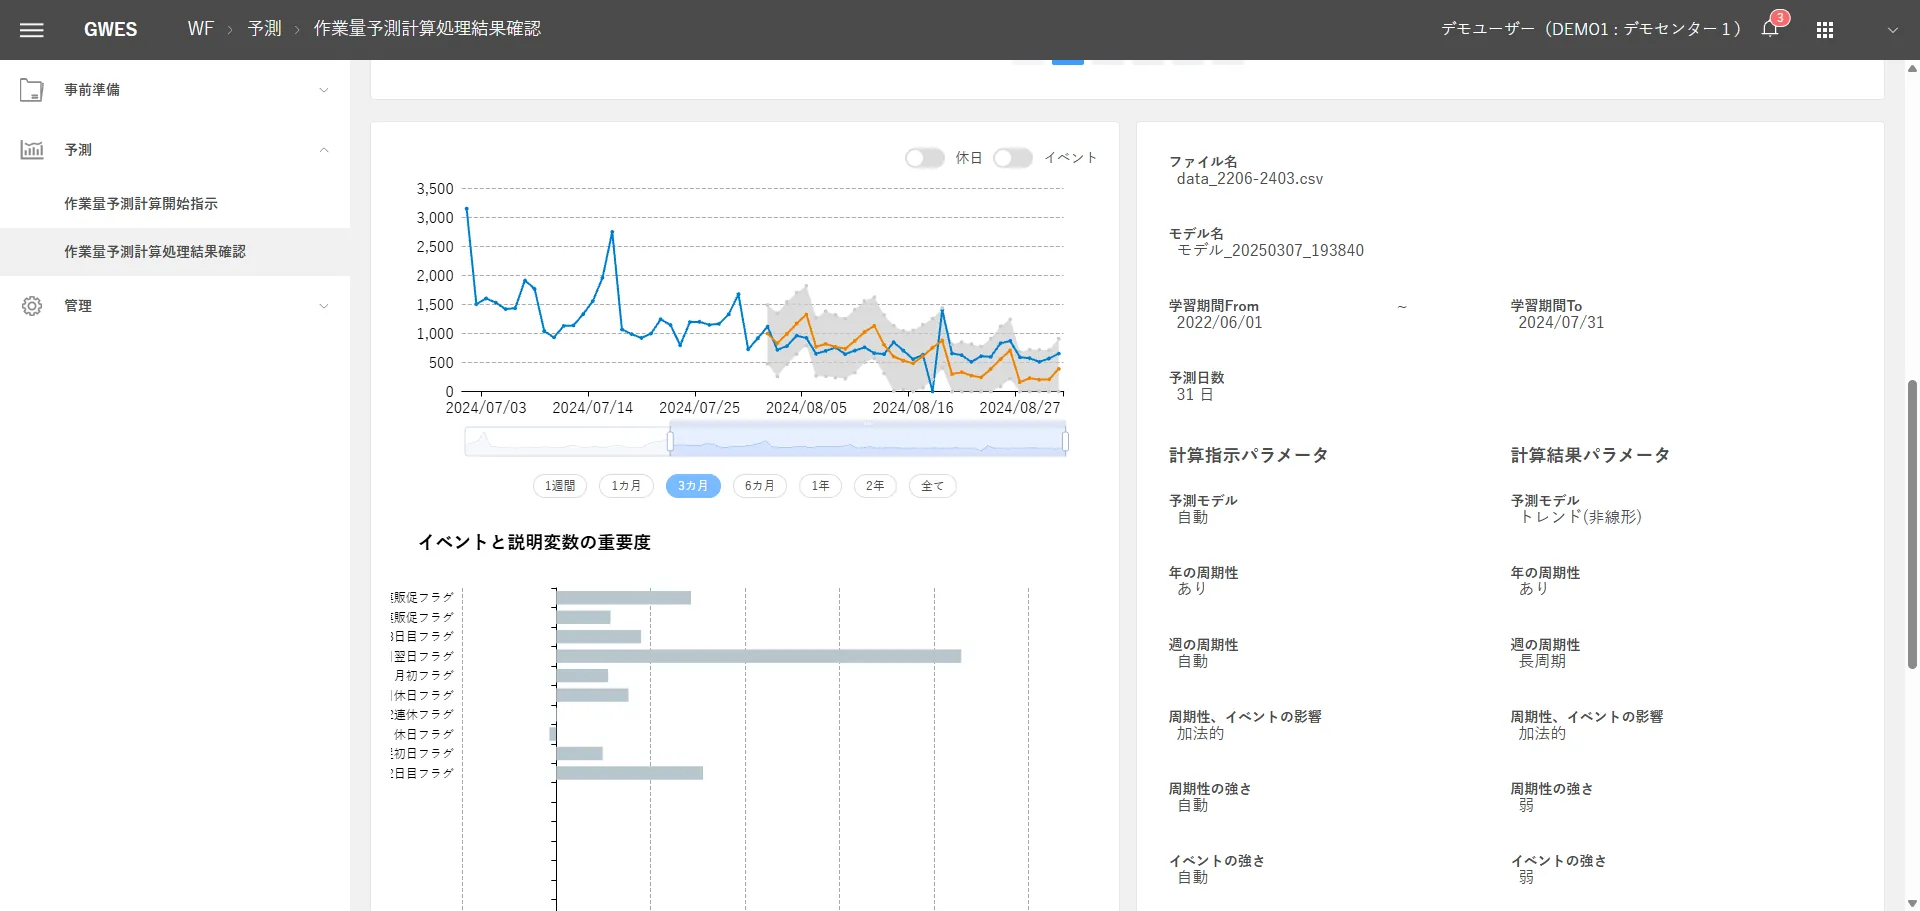

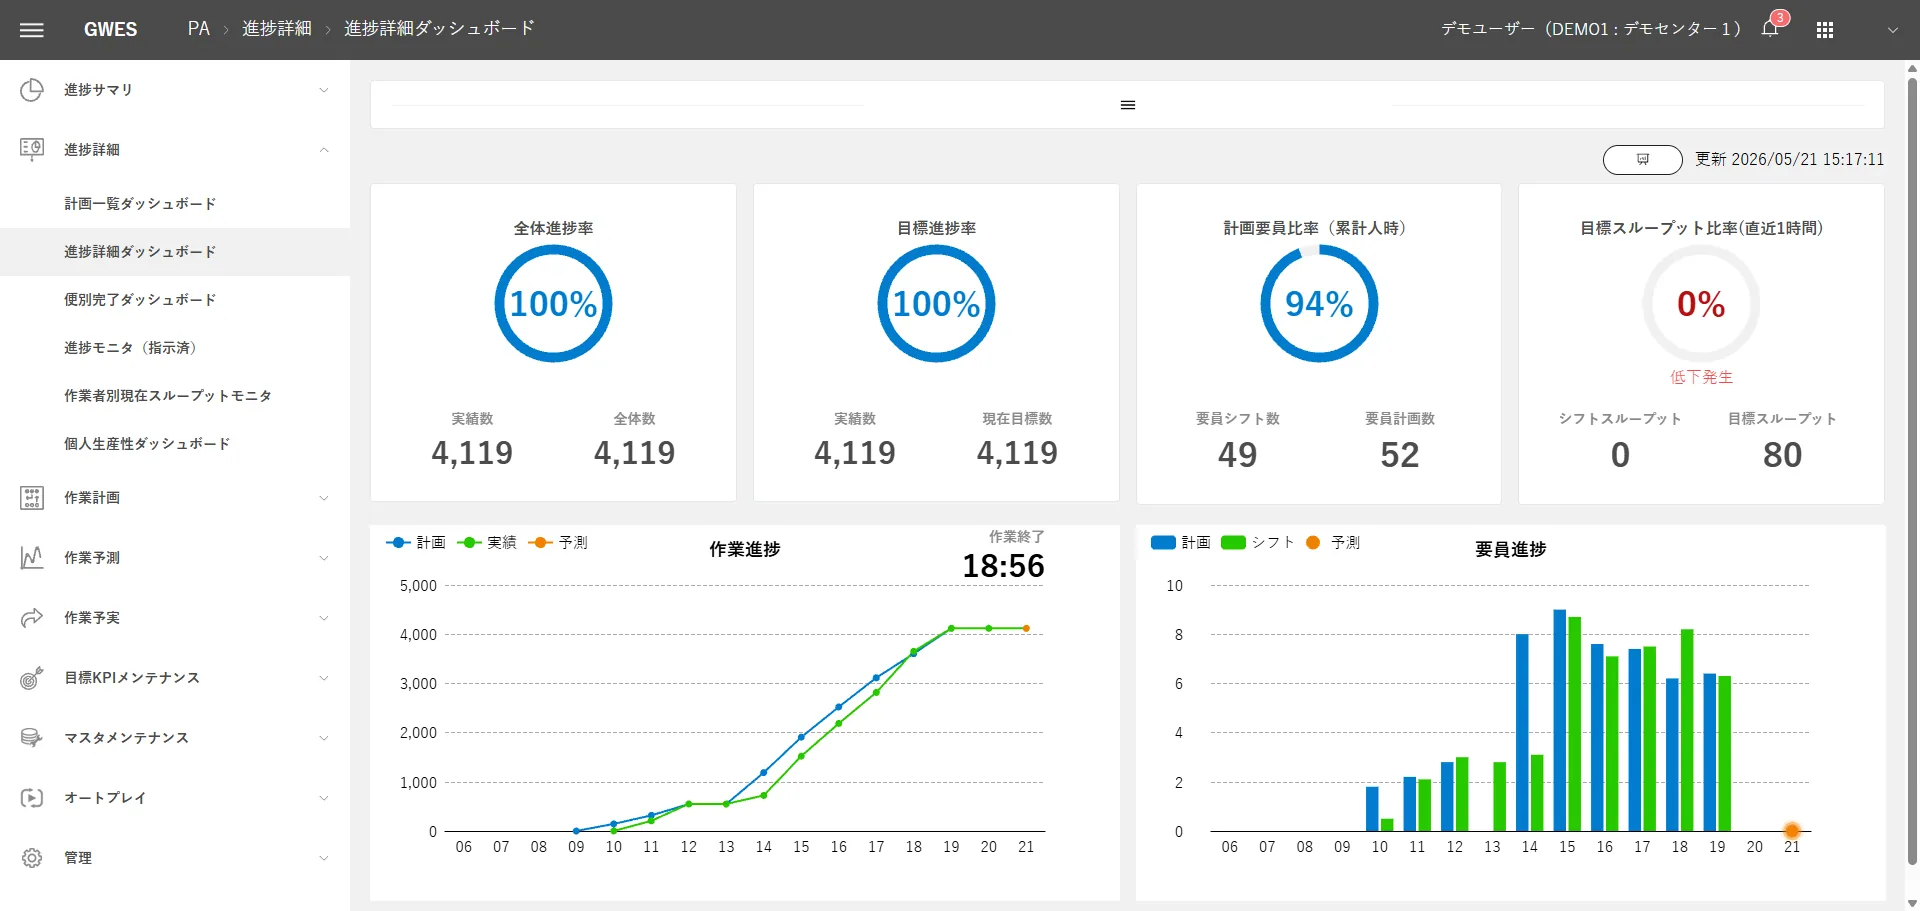

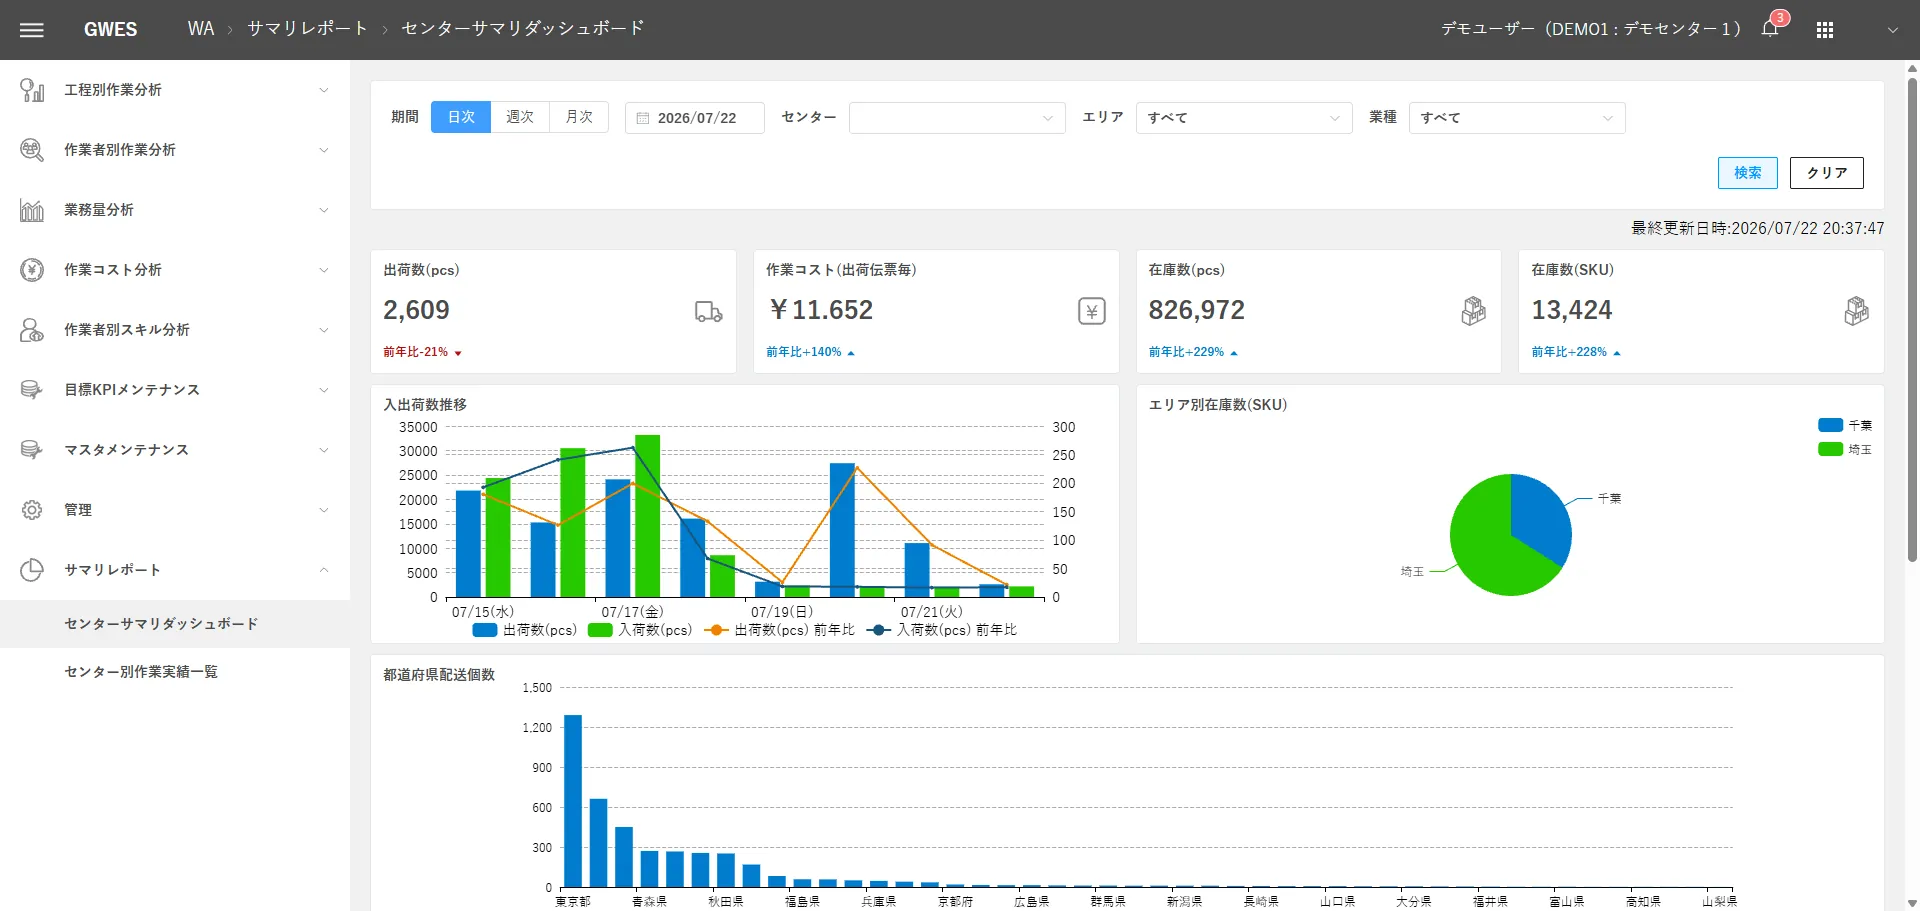


Optimization



Infrastructure



FIRST STEP
See where you stand with a free GPIM assessment
We clarify which level your logistics facility is at now and what to do next.